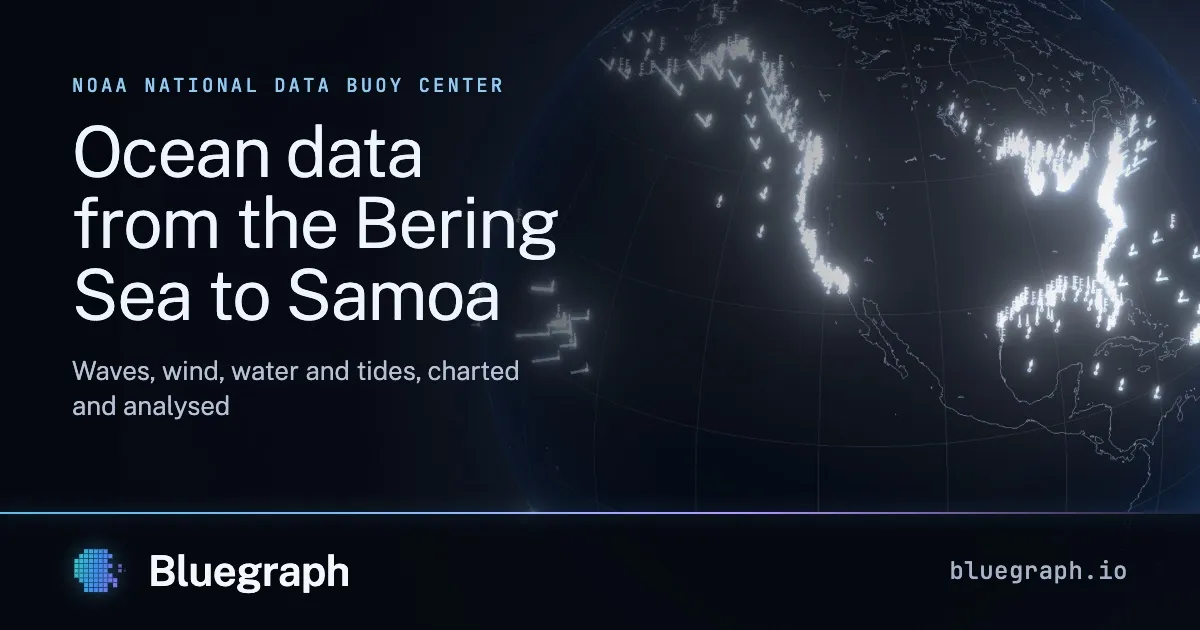
Bluegraph – Explore NOAA buoy data, rebuilt in 3D from measured spectra
Observations from the buoys, coastal stations, tide gauges and estuary stations run by NOAA and its partners, across two oceans, the Caribbean and the Great Lakes: charted and analysed.
以下正文同步自 Hacker News,版权归原站所有,已转换为易读排版。
Observations from the buoys, coastal stations, tide gauges and estuary stations run by NOAA and its partners, across two oceans, the Caribbean and the Great Lakes: charted and analysed.
113.7 million data points collected since April 2025
Latest observation 29 Sep 02:50 UTC · 700 of 715 stations reporting in the last 3 hours
Find a station AllNortheastGreat LakesInland lakesSoutheastGulfCaribbeanCaliforniaPacific NorthwestAlaskaHawaiiPacific islandsColumn height: significant wave height Brightness: dominant period, 4 to 16 s
Buoys 286 Coastal 175 Tide gauges 226 Estuaries 28
Notable now
latest readings
The globe is drawn by script; the notable readings and the regions below read without it.
正文由 探How 从来源站点 RSS 同步,内容未经改写;遇到排版缺失或需要图片、视频时请以原文为准。