Why Everything Is Starting to Look the Same
I’ve spent most of the last decade unable to answer the simplest question anyone asks: where’s home? I’ve lived in multiple countries, with a passport situation that makes border guards frown. Now I’m moving again, to T…
以下正文同步自 Hacker News 最新,版权归原站所有,已转换为易读排版。
Lauren Leek
Aug 10, 2026
487
57
110
Share
I’ve spent most of the last decade unable to answer the simplest question anyone asks: where’s home? I’ve lived in multiple countries, with a passport situation that makes border guards frown. Now I’m moving again, to The Hague, and it was house-hunting that finally made me see it. Every flat I scrolled, in a city I barely know, I already recognised: the same refinished parquet, matte-black taps, rewilded pot plant on the same windowsill. Same with the café near every place I’ve lived, flat white and exposed brick and oat milk assumed. I’m at home everywhere because everywhere is converging on the same few templates, and I’m exactly who those templates were optimised for. The recommender’s algorithm’s ideal user, basically.
Here is what puzzled me. We have never had more individual data and naive intuition says all that granular personal data should fragment us, splinter the world into a billion niches. And yet the opposite is happening. The more the machines learn about us as individuals, the more alike our worlds look. That paradox, more personalisation producing more sameness, is what this piece is about, and by the end I want to convince you this is a political economy story that needs and has an easy intervention.
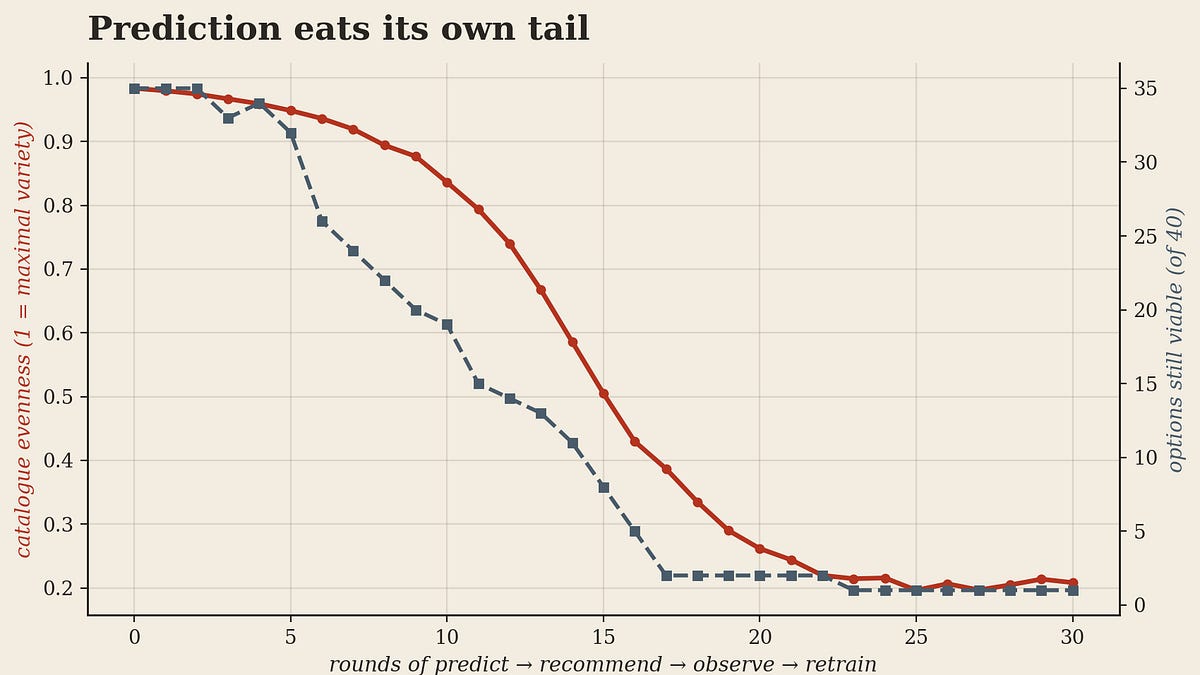
Imagine forty options, cuisines, genres, shop types, and a standard algorithm: predict what people want, show them more of it, watch what they pick, update. Then let the loop run.
The mode gets shown more, so it gets picked more, so the model grows more confident the mode is what people want, and the tails starve. Within a few dozen rounds, a catalogue that began almost perfectly even collapses onto one dominant option. But why does it collapse toward the mode rather than fan out across all that individual data?
Almost every recommender is trained to minimise a prediction error, get the rating wrong by as little as possible, or maximise the chance you click. But the problem is that under squared-error loss, the prediction that minimises your expected error is the conditional mean. So an algorithm that is uncertain about you, and it is always at least a little uncertain, hedges toward the average. The more uncertain it is, the harder it pulls you toward the crowd. This is why more data doesn’t save us. Personalisation under a standard loss function is regression to the collective mean with extra steps. Variance, the technical word for the stuff that makes you you, is expensive to predict. Basically, diversity is variance, and optimisers are built to minimise variance.
What makes this political economy (and hence why I decided to write about it) is that the system doesn’t have to be right, it only has to be listened to. A recommender that’s a mediocre predictor of what you’d love in a rich, diverse world becomes an excellent predictor of what you’ll click in the impoverished one it creates.
This is also where I should say plainly that I didn’t invent any of this. Economists would call it performativity, the way a model, once acted on, bends the world into agreement (MacKenzie’s markets that reshaped themselves to fit their own equations). Machine-learning researchers have started calling a version of it model collapse: train a system on its own outputs for long enough and the variance drains away until everything converges on the mode. Urbanists have their own word, placelessness, for what’s left when everywhere optimises toward the same template. What I’m going to show here though is that these are one mechanism seen at four different scales. Think of it as temperature zero for culture: always take the most likely next token, and watch the surprise drain out of the sequence. Let’s make it concrete.
As a first test, I took the Greater London Authority's map of 640 high streets, mapped 18,000 London food places onto it, tagged each by cuisine, and flagged the chains, meaning any name recurring three or more times across the city (Subway, Pret, PizzaExpress, the M&S Food-to-Gos). Then I asked a question you can only ask with the whole city at once: how similar is any one high street to any other? For every pair I compared their cuisine mix, scored 0 for nothing shared, 1 for identical for all sixty thousand pairings.
Pick two London high streets at random and, on average, they already share almost half their food profile. For a city like London that sells itself on the variety of its neighbourhoods, that's a lot of similarity. But the average is just a snapshot, what drives it is even more interesting.
So, I sorted streets into quartiles by chain share. The streets with the fewest chains are the most distinctive; the other three quartiles all look noticeably more like the rest of London. Chains seem to act as a convergence layer: you don’t need a high street to be dominated by them. A relatively small number of repeated names is enough to make otherwise different streets resemble one another more.
And that’s not surprising since the chains are running exactly the loss-minimising loop from the last section. Gail's (my favourite UK middle class bakery/coffee shop) uses an AI site-selection system that learns from its existing bakeries, combining trading data with demographics, competition and location to forecast where the next one should work. Pret has used hundreds of data points, from historic sales to footfall, to decide where it opens. Waitrose has long run its own version with geodemographics, GIS and regression (raising my favourite question of what came first: the Waitrose or the gentrification?) Each of these is a model asking "where does it look most like the places that already worked?", which is to say: find the mode, and put another one there. Congratulations: your neighbourhood has been classified as Gail's-compatible, and is starting to look a bit more like all the others. I ran the numbers on my own future street in The Hague. Luckily, Pret and it’s highly mediocre coffee hasn’t yet decided to move the Netherlands yet.
My previous pub-closures work gets at the same loop from the other side. I trained a model to predict which pubs were most likely to close and, in doing so, effectively produced a profile of the kind of pub most likely to survive. The counter-intuitive bit is that many of the things that make a pub unusual, local or hard to categorise can also make it look risky. The features that make a place difficult to predict are often the same ones we later describe as its character.
The high street flattens in physical space. I assumed culture would too, so I checked, and the answer turned out to depend entirely on where you point the loop. I started with lyrics: every year-end Billboard Hot 100 hit from 1950 to 2015, just over four thousand songs, measured for how the words changed.
Within a song, the flattening is unmistakable. Vocabulary richness, distinct words relative to length, has fallen by more than a quarter since the early 1960s, while the share of repeated lines has climbed by nearly a third. The modern hit says less and says it more often, because the hook that works gets repeated. Btw, in the data AI music hasn’t even entered the scene here yet…
But zoom out to the chart and the loop reverses. Hits resemble one another less than they used to, the vocabulary across the chart as a whole has widened, and the biggest study of cross-national streaming charts finds music diversity across countries rising since 2017, not falling. I fully expected to find monoculture here, but it handed me the key to the whole argument. Prediction flattened the one dimension something was optimising on, the hook, the singable mode, and left every other dimension free. Nothing was minimising a similarity loss across songs, so nothing pulled them toward each other. Something was very much minimising a boredom loss within songs, so they collapsed inward. The flattening is a choice about which dimension we point the loss function at. Which means the real question is never whether prediction flattens the world, but which dimension we’ve aimed it at, and who did the aiming.
And on people, we’ve aimed it straight at consumption. A recommender shows you the handful of things it predicts you’ll like, you engage because they were selected to be engaging, it retrains on that, but it only ever learns from what it already showed you. Everything it didn’t surface decays out of consideration, untested. So, we have more data points than ever, but they’re a censored sample.
MovieTweetings shows the endpoint: nearly a million public film ratings since 2013, across roughly 38,000 films. If everyone watched a bit of everything, the line would run along the diagonal. Instead it shoots almost straight up. The top one percent of films, about 380 titles, pull nearly forty percent of all attention; half of everything anyone watched sits in the top two percent; thirty-eight films, a tenth of one percent of the catalogue, account for more than an eighth of all activity on their own.
That’s what “more choice than ever” looks like from the inside: a vast catalogue you can technically reach, and a near-vertical wall of sameness almost everyone actually climbs. We call ending up at the top of that wall “knowing your taste”, but it’s just the menu that narrowed.
The same problem showed up in an experiment of my own, one that happens to also be a small research industry right now. Everyone from survey shops to LLM labs is trying to build synthetic respondents: "personas" meant to behave like a population before you spend money asking actual humans. It's a genuinely useful idea. It also fails in exactly the way this whole essay is about, which is why I couldn't resist poking at it.
The obvious way to do it is to give each person some attributes and let a model decide what they think. But real populations aren’t collections of independent variables. Age predicts education, education interacts with income, values cluster with attitudes, friends influence friends. In other words, people come in lumps.
So I tried progressively harder to put the lumps back in. I started with a deliberately dumb generator that rolls each characteristic independently, then added latent psychological traits, recognisable archetypes, and eventually social networks in which similar people cluster and influence one another. I did the same on the response side: independent sampling through correlated, conditional and causal models.
A problem arose: the fancy models produced more elaborate stories about why people differed, but the population-level answers stayed remarkably smooth, on many questions spread almost evenly, close to maximum statistical diversity. In one comparison the dumb independent model was the best at matching the target distribution.
And it’s the same theorem as the recommender, just standing further back. A synthetic population trained to get the averages right buys that average-rightness the only way any optimiser can, by suppressing variance. The marginal comes out perfect and the structure, the clusters, the correlations, the strange combinations, slowly dies. Which is a genuine problem, because a population can have perfectly respectable averages while representing nobody in particular. Fifty percent left and fifty percent right describes a country split into two furious camps and a country full of mild centrists equally well. And this is now (occasionally and by some) being sold, with a straight face, to campaigns and market researchers as a substitute for asking actual voters. (I may or may not have argued exactly this on a panel in London a few weeks ago.)
The obvious objection is: so what? If people like Gail’s, Spotify gives me music I enjoy (I’ll admit that I recently moved back to Spotify after getting way too frustrated with the algorithm of Apple Music, Apple, seriously, step this up), and Netflix saves me forty minutes of scrolling, maybe predictability is just convenience.
But v
正文由 探How 从来源站点 RSS 同步,内容未经改写;遇到排版缺失或需要图片、视频时请以原文为准。