How Chiron Changes AI Incident Investigation on ORCA-bench
How Chiron Changes AI Incident Investigation on ORCA-bench
以下正文同步自 Hacker News 最新,版权归原站所有,已转换为易读排版。
Observability
Ai Root Cause Analysis
Opentelemetry
Ai Observability
Sre
How Chiron Changes AI Incident Investigation on ORCA-bench
Chironvision Inc
19 min read·
Oct 1, 2026
--
By Devansh Saxena, Founding Engineer Chironvision Inc.
Chiron prepares incident context before the AI asks its first question — connecting the symptoms, their timing and the services involved. The agent starts with that evidence already assembled.
When a customer reports that checkout is broken, an AI agent must find the relevant failures, establish when they began and connect them across services. Gathering and aligning that evidence can require repeated searches through logs, metrics and traces before the agent can explain the cause.
Chiron performs this correlation as telemetry arrives. By the time an investigation starts, the agent can query a compact view of the affected services, their dependencies and how their condition changed. Our ORCA-bench evaluation examines what this prepared context changes in root-cause accuracy, investigation effort and token use.
We changed what the agent reads. Chiron is ChironVision’s in-cluster observability engine. It correlates OTLP metrics, logs and traces as they arrive and keeps state per request hop, service and flow, with history. That state forms a context graph in which degradation propagates from a hop to service health and on to the user flows that depend on it. The agent queries this state through an API. No LLM runs inside Chiron.
Figure 1. query-time vs ingest-time correlation
Chiron connects incident evidence as telemetry arrives, so the agent starts with timing and dependencies already assembled.
Results across the benchmark
ORCA-bench tests incident investigation in a running e-commerce application with injected faults. An agent receives a user-style problem report and must identify all expected root causes, explain their mechanisms and cite supporting evidence. Our evaluation uses 664 public tickets: 526 incidents and 138 quiet-window controls.
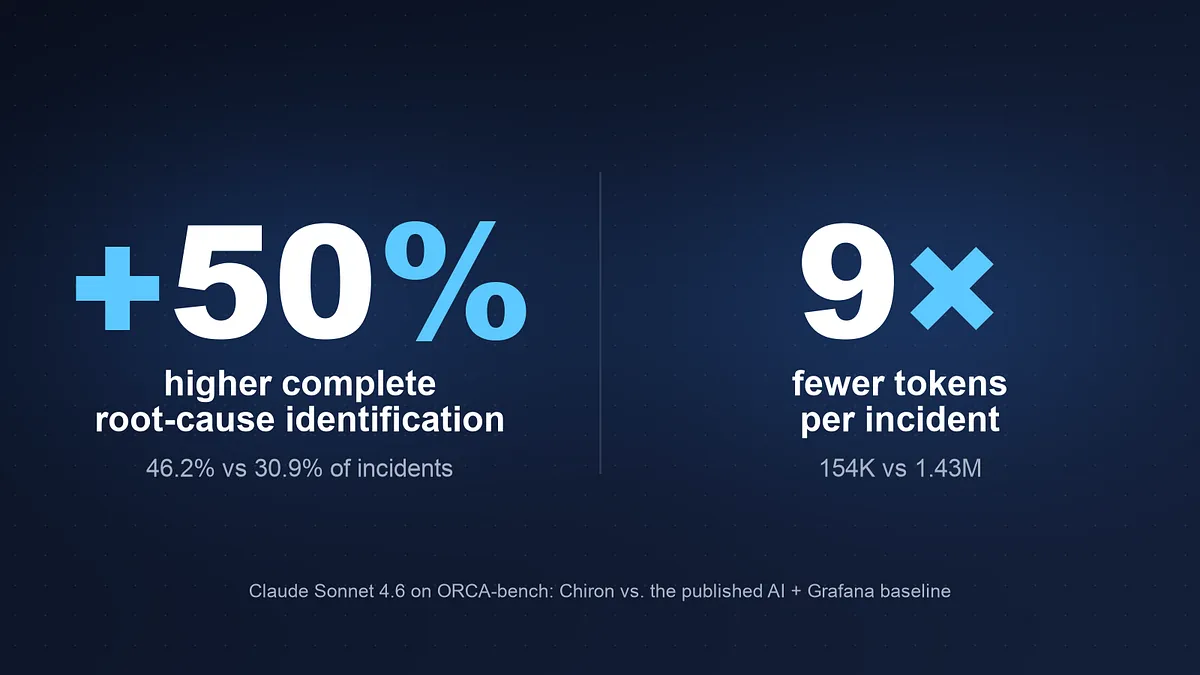
On 526 ORCA-bench incident tickets, Chiron with Claude Sonnet 4.6 named every expected root cause in 46.2% of cases. The published Sonnet + Grafana reference reports 30.9% on 884 incidents. Sonnet with Chiron used 154K tokens per incident trial on average; the paper reports 1.43M per incident trial. This is a tuned setup: Chiron’s digest carried a cause catalogue and investigation instructions fitted to this benchmark, which the paper’s Grafana supported oagents did not have, so it is not a zero-shot, like-for-like comparison. The token accounting and evaluation scope are specified below.
Evaluation scope. Our run uses the public ORCA-bench tickets covered by our telemetry extract, a subset of the same benchmark. The published reference covers the paper’s full ticket set. Fitted application knowledge and query limits differ; tokens are compared per incident trial; How we tested gives the counts and settings.
Footprint and cost. The replay processed 12.5 GB of telemetry and retained 27 MB of RCA state. This compares the input tape with the selected state available to the investigator; raw telemetry is not retained in that state. Reported model cost was about $0.26 per Sonnet ticket and $0.16 per Gemini ticket. Prompt caching means token reduction and billing reduction are different quantities.
The five agents in the paper’s main code-and-telemetry evaluation each spend over half a million tokens per incident trial and stay under 31% RCA accuracy. Sonnet reading Chiron’s state reaches 46.2%, at 154K tokens per incident trial. The paper’s Sonnet without source code reaches 21.4%; our investigators retained source access.
Figure 2. Published agents: ORCA-bench v3 Tables J.1, J.5 and J.9. Chiron: our Sonnet run. All plotted scores use GPT-5.4 as judge model; our run uses a public subset of the same benchmark, with different recorded judge effort. Gemini is compared with Sonnet separately under a shared Gemini judge.
The improvement is not uniform across metrics. RCA depth was 42.6%, below the published Sonnet result of 46.7%. Finding the expected causes does not guarantee a complete explanation with all the required evidence; the case studies and judge analysis examine that remaining work.
The paper’s Sonnet accuracy falls from 58.7% on Easy tickets to 8.6% on Hard, whose expected cause count averages 4.4. In our cohort, Sonnet with Chiron stays between 41.4% and 50.0% across the three difficulty groups. Easy remains below the published reference. Excluding imageSlowLoad raises our Easy accuracy from 48.0% to 54.9%, showing how much this uninstrumented fault affects our result; it does not establish the paper’s performance on an equivalent filtered cohort.
Figure 3. Accuracy by difficulty. Paper: v3 Figure 5 and Table J.4b. Chiron: 171 / 191 / 164 incidents, or 144 / 152 / 161 excluding imageSlowLoad. Filtered Chiron bars are a diagnostic breakdown, not a matched comparison with the paper.
The paper reports about 52 telemetry commands per Sonnet ticket; 32.2% return empty results or errors. Its command shares imply roughly 77 commands in total. On Chiron, Sonnet averages 2.3 state reads and 12.5 total commands per incident ticket. Source investigation remains substantial at 8.2 commands, versus about 11.5 derived from the paper. No Chiron state read returned empty in the reported trajectory analysis. These are descriptive workload comparisons: the paper’s telemetry-command mean includes controls, while our trajectory analysis covers incidents.
Figure 4. Commands by category. Paper telemetry totals: v3 Figure 7; source and other are approximated from command shares in Figure J.2. Chiron: 526 incident trajectories per model. The paper reference covers all 1,079 tasks. Source commands include searches as well as full-file reads.
Sonnet averaged 12.5 commands per incident with Chiron, including 8.2 source-investigation commands. Prepared context supplied the evidence; checking the causes remained part of the work.
Overall hallucination under the benchmark’s definition is 13.1%, compared with the paper’s 14.8%. Here, hallucination means a non-empty report naming none of the expected causes; it does not count every unsupported statement or extra cause. In our run, 61 of 69 such reports occur on imageSlowLoad tickets. The remaining 457 tickets have a rate of 1.8%, a within-run breakdown. On controls, Sonnet stays quiet on 67.4%, versus the paper’s Sonnet at 57.9% and Opus at 84.1%. The digest labels alerts that are no longer active, giving the agent evidence to distinguish historical trouble from a current incident.
Figure 5. Hallucination and control accuracy. Paper: v3 Tables J.1, J.2, J.5 and J.6. Chiron: 526 incidents and 138 controls. The 1.8% subgroup excludes imageSlowLoad only; it is not a measure of all false claims.
How Chiron prepares evidence for investigation
Chiron uses stateful stream processing with keyed state kept next to the partition that updates it. Signals for an entity are routed to its owning partition, where the engine updates the correlated state as they arrive. The agent then reads that prepared state rather than reconstructing the same relationships across stores for each question. Cascades connect hop state to service health and dependent user flows; snapshots preserve the history needed to investigate when a condition changed.
Figure 6. The Chiron data path used in this evaluation. Incoming signals update state in the owning entity partition; cascades and history provide the context exposed to agents.
How the state addresses investigation problems
The paper describes several obstacles to incident investigation. The table connects each obstacle to the evidence Chiron prepares and an observation from our evaluation. It explains how the prepared context is used; isolating the contribution of an individual feature would require an ablation.
The agent receives this information through the incident digest described next. Missing instrumentation, extra background causes and evidence outside the RCA state remain limitations, discussed after the investigations.
Every investigation starts with one incident-context call over the ticket’s window. The digest combines two distinct inputs.
Correlated state, from the engine. Degraded hops, services and flows, backed by live numbers; the cascade linking a hop to service health and user flows; log-signature counts with the tick where they start rising; and hop error, latency and traffic changes with their peaks. Items carry the relevant OTel metric, span or parsed log signature.
Application knowledge, fitted to this shop. A cause catalogue maps symptom patterns to fault flags, for example “Cart AddItem/GetCart/EmptyCart errors → cartFailure”, with evidence guidelines such as “name a flag only with a matching symptom”. The paper’s Grafana agents had neither this catalogue nor these instructions.
The catalogue supplies a mapping, but the agent still has to choose which candidates explain the report. The flags evaluated in a window include flags that were not causes; in Case 1, nine flags appear and one is expected. Rising log tallies help identify active changes, flat tallies help reject candidates, and the cascade links a failing flow to the hop beneath it. Source code remains useful for explaining how the fault produces the symptom.
The first digest brings together rising errors, stopped traffic and shared dependencies, giving the agent several relevant paths to investigate.
Four investigations with prepared incident context
The investigations below show how Chiron’s prepared context supports diagnosis: separating relevant failures from background activity, distinguishing payment errors from stopped traffic, and connecting checkout problems to a shared dependency. In all four selected cases, both Sonnet and Gemini identified every expected cause. Their paths reveal which evidence Chiron supplied upfront and which questions still required source inspection or further checks.
The selection contains one Easy, two Medium and one Hard ticket. These successful investigations illustrate how the context was used; aggregate success rates are reported above. The chart preserves the command order for each Chiron case. Its paper row is an aggregate workload reference, not a run on these tickets. The raw-backend paragraphs describe plausible ways to retrieve equivalent evidence, not measured counterfactual runs.
Figure 7. Commands for the four selected investigations. Each Chiron row is an observed command sequence. The paper row groups approximate category totals from its average Sonnet run; its order is not an observed sequence. Sources: paper v3 Figure 7 and Figure J.2; our case trajectories.
Case 1 Finding the cart fault among concurrent signals
Easy ticket: “Empty Cart waits about 15 seconds, then HTTP 504”. Expected cause: cartFailure.
Outcome and Chiron’s contribution. Both models identified cartFailure. The first digest placed the cart errors alongside other rising signals and their timing, so the investigation could check which failure explained EmptyCart rather than follow the largest log increase.
What Chiron showed. Three log signatures rising in the window: ad manual GC (+97), cart storage errors with log body “connect to redis” (+9), and payment charge errors (+1). Nine flags were evaluated in the window.
Sonnet confirmed the symptom was live with one state read, then read CartService.cs, ValkeyCartStore.cs and Program.cs end to end. It found that EmptyCart routes to a store wired to badhost:1234, named cartFailure, and set the ad and payment signatures aside as concurrent but unrelated. Gemini hypothesised first and needed two grep retries for what one full read gave Sonnet.
Retrieving equivalent evidence from raw backends could involve log searches tallied by service and message, PromQL ranges to check whether alerts remain active, and traces on the cart route. Chiron placed the rising signatures a
正文由 探How 从来源站点 RSS 同步,内容未经改写;遇到排版缺失或需要图片、视频时请以原文为准。