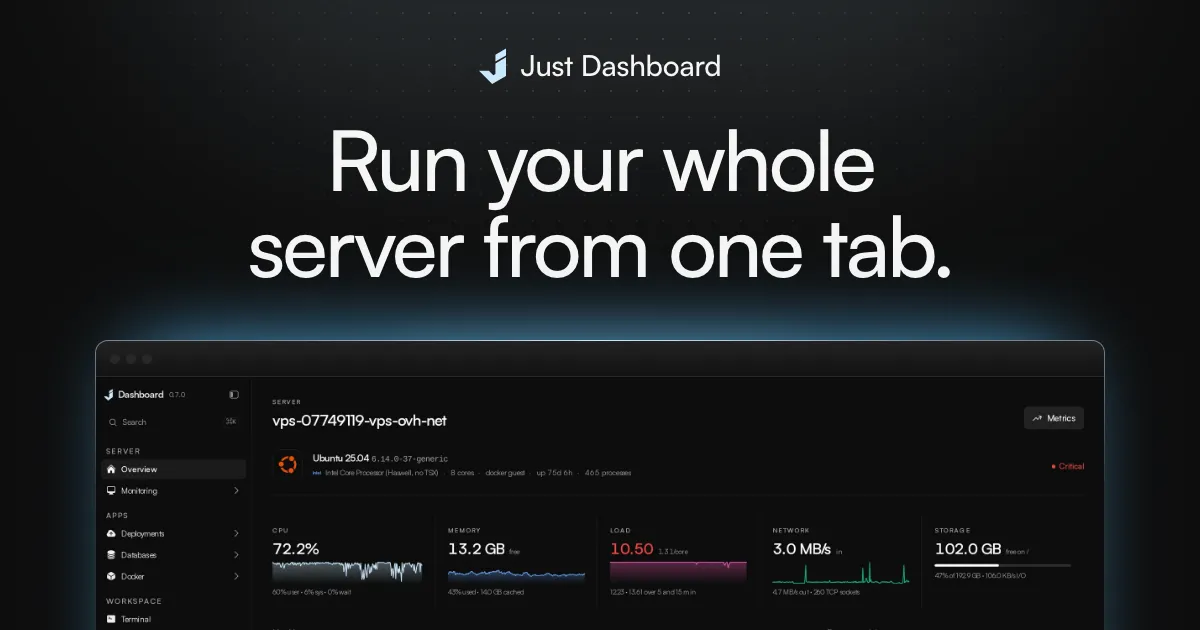
Just Dashboard open-source dashboard for managing your VPS
Metrics, Docker, deployments, databases, a real shell, files and git. Self-hosted, open source, and only reachable on your private network.
以下正文同步自 Hacker News 最新,版权归原站所有,已转换为易读排版。
Metrics, Docker, deployments, databases, a real shell, files and git. Self-hosted, open source, and only reachable on your private network.
View on GitHub
https://box.tailnet-name.ts.net:8443
Go backend
Next.js frontend
One docker compose stack
Tailscale by default
Ubuntu
Debian
The pages you will actually live in.
Every frame below is the real product, captured on a running install.
Point it at a repository, an image, a template or a Compose file. Every release is immutable, so rollback reactivates what ran before, and web services get a health-gated cutover.
Exposure, disk, memory limits and security posture, each with an explanation and, where possible, a button. Stacks deploy and roll back with the compose diff shown first.
PostgreSQL, MySQL and MariaDB, SQLite, SQL Server, ClickHouse, Oracle, MongoDB and Redis. A database started here gets a connection string, and one press opens it to the internet or closes it again.
A PTY into a host account. Sessions group windows, each named after what it is running, with Files and Git sitting beside the shell.
Stage single lines, resolve conflicts side by side, rebase behind a recovery branch, and review pull requests on GitHub, GitLab and Gitea without leaving the page.
Drag and drop, upload whole folders, search by content, archive and extract. Every path is checked against the configured roots before anything happens.
Most panels show you a number and leave the reading to you. Sixty-eight percent CPU, exit code 137, restarted twelve times.
Just Dashboard says the server is waiting rather than merely busy, that a container was killed for its memory limit and what the limit was. Where it can fix a finding, the finding comes with a button.
Processes, logs, the proxy, the firewall, backups, packages and the dashboard's own updates, each drawn as what it is.
Cmd K from anywhere. Every nested page is listed, and every page comes back the way you left it.
CPU split by user, system, iowait and steal. Memory judged on what is available. Pressure, disks, inodes, sockets and interfaces.
Firewall, sshd, fail2ban, open ports, connections, logins and who is attacking, on one page.
Scheduled archives to disk, S3 or B2, native database dumps, and a list of every volume and database nothing covers.
Sites, streams, certificates through certbot including DNS wildcards, and a live TLS report.
Discord, Slack, Telegram, e-mail, a webhook, and the commit's status on GitHub.
The dashboard pulls, rebuilds and restarts from a container that outlives the restart. Host packages too.
Anyone who reaches it with a valid session has root on the machine. So it sits behind your VPN or an SSH tunnel, and that is enforced rather than recommended.
The internet0.0.0.0/0
Allowlist
Password
One-time code
Root shell12h session
Audit logevery request
Refused at the allowlist. The login form is never served to an address outside it.
Allowlist before authentication
The API refuses every address outside the allowlist, before the login form is served.
Tailscale by default
Invisible to the internet, answering on your tailnet with a real certificate.
Two-factor, enforced
An enrolled account is always asked for its code. A policy decides who must enrol.
Typed confirmations
Destructive actions pause. The unrecoverable ones want a typed phrase, checked server-side.
An audit log for every change
Every state-changing request is recorded with who, what and when. Sign-ins too.
Three roles, checked on the route
Read-only, limited and admin, enforced on the API and never in the interface alone.
One click each. Every card says whether you create the first account yourself, sign in with a password this server generated, or find no sign-in page at all.
PostgreSQL
Redis
n8n
Grafana
Uptime Kuma
Vaultwarden
Nextcloud
Jellyfin
code-server
Ollama
Open WebUI
ntfy
Qdrant
NocoDB
Gitea
MinIO
MySQL
MariaDB
PostgreSQL
Redis
n8n
Grafana
Uptime Kuma
Vaultwarden
Nextcloud
Jellyfin
code-server
Ollama
Open WebUI
ntfy
Qdrant
NocoDB
Gitea
MinIO
MySQL
MariaDB
PostgreSQL
Redis
n8n
Grafana
Uptime Kuma
Vaultwarden
Nextcloud
Jellyfin
code-server
Ollama
Open WebUI
ntfy
Qdrant
NocoDB
Gitea
MinIO
MySQL
MariaDB
PostgreSQL
Redis
n8n
Grafana
Uptime Kuma
Vaultwarden
Nextcloud
Jellyfin
code-server
Ollama
Open WebUI
ntfy
Qdrant
NocoDB
Gitea
MinIO
MySQL
MariaDB
MongoDB
Prometheus
Portainer
DocuSeal
SearXNG
Seerr
Beszel
Opengist
Meilisearch
Typesense
RabbitMQ
Dozzle
FreshRSS
linkding
Trilium
wallabag
Gotify
Caddy
MongoDB
Prometheus
Portainer
DocuSeal
SearXNG
Seerr
Beszel
Opengist
Meilisearch
Typesense
RabbitMQ
Dozzle
FreshRSS
linkding
Trilium
wallabag
Gotify
Caddy
MongoDB
Prometheus
Portainer
DocuSeal
SearXNG
Seerr
Beszel
Opengist
Meilisearch
Typesense
RabbitMQ
Dozzle
FreshRSS
linkding
Trilium
wallabag
Gotify
Caddy
MongoDB
Prometheus
Portainer
DocuSeal
SearXNG
Seerr
Beszel
Opengist
Meilisearch
Typesense
RabbitMQ
Dozzle
FreshRSS
linkding
Trilium
wallabag
Gotify
Caddy
Two commands, then a login on your tailnet.
The installer guides you through private access, the first account, and optional settings.
$ git clone https://github.com/JustDashboard/Just-Dashboard.git$ cd Just-Dashboard && sudo ./install.sh
Copy
Needs a Linux server with sudo. Follow the 0.8.1 install guide to set up patch update checks. To upgrade later: git pull && docker compose up -d --build
The machine stays invisible to the internet and the dashboard answers on your tailnet with a real certificate. No port is opened.
Served on loopback. The installer generates the master key and a first password, builds the stack, and prints the command to get in.
Your configuration, database, accounts and sessions survive a pull and rebuild, the in-app update, or running the installer again.
Just Dashboard is AGPL-3.0 and built by one person. The code, the changelog and the issue tracker are all in one place.
View on GitHubBuy me a coffee
Companies and individuals who would like to sponsor the project can write to ionmoisei755@gmail.com and will be listed with a logo and a link.
正文由 探How 从来源站点 RSS 同步,内容未经改写;遇到排版缺失或需要图片、视频时请以原文为准。