Show HN: Reddit Stock Chatter Is Best Shorted
For roughly 100 days, I let a bot track Reddit stock chatter across 10+ subreddits. The bot looked for unusual bursts of attention, handed a fixed list to Claude and sent me a Telegram brief. Based on the these spiking …
以下正文同步自 Hacker News 最新,版权归原站所有,已转换为易读排版。
For roughly 100 days, I let a bot track Reddit stock chatter across 10+ subreddits. The bot looked for unusual bursts of attention, handed a fixed list to Claude and sent me a Telegram brief. Based on the these spiking tickers and my general curiosity, I used the bot ad-hoc with a ticker to ask Claude for a Buy, Hold, or Sell call.
This is an exploratory software study, not investment advice. I built StockBot to learn how a language model would behave around noisy market data. I would not use or recommend these rules as a trading strategy. The system had no broker connection or order path.
By August 28, the archive held 717,205 ticker mentions and 78 explicit model calls. Once later prices existed, I could ask what followed the alerts instead of guessing from screenshots.
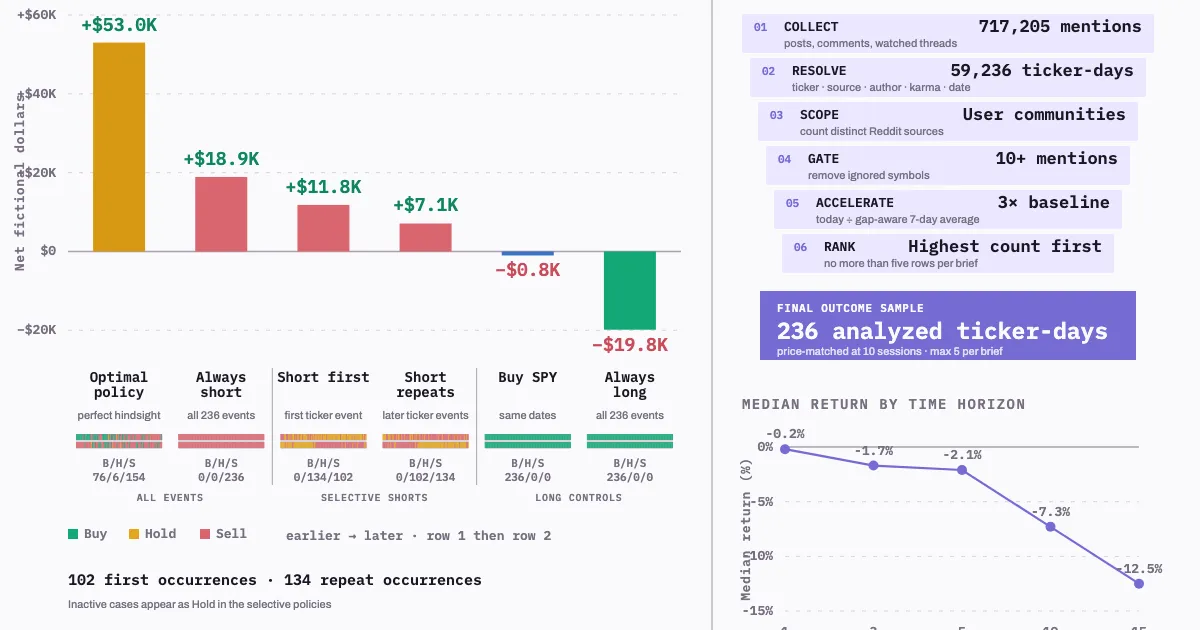
The first result came from 236 price-matched spike unique ticker-day pairs. The median stock fell 7.3 percent over ten sessions. Deterministic code selected these spikes without a language model chose the ticker or its direction. The second result came from replaying 69 saved evidence prompts across 29 large language model (LLM) configurations.
The numbers that matterten-session outcome · simple baseline
I designed the checks after seeing the archive. There was no preregistered hypothesis, holdout period, confidence interval, or multiple-testing correction. The results describe this archive. They do not establish a repeatable market strategy.
StockBot looked like one bot in Telegram. The archive contains two different selection paths.
Timed jobs found unusual ticker chatter and sent up to five spiking rows through Telegram. A surfaced row meant “look here.” It had no Buy or Sell direction.
An authorized Telegram user requested /dd TICKER. The bot gathered one evidence packet and asked an LLM for Buy, Hold, or Sell.
Briefs record what code surfaced. Due-diligence (DD) prompts record what I chose to investigate. That difference changes what every chart counts. I keep these two samples and results separate.
Both paths sat inside the same three-loop system:
Three loops, one archivecollect · answer · measure
The frozen counts and joins are in Appendix A1. The component-level map, schedules, external sources, and deployment check are together in Appendix A2.
I pointed the main configuration at 12 penny-stock and momentum communities. The list was anchored by r/pennystocks and included r/Shortsqueeze and r/wallstreetbets. The collection paths, author fields, karma cache, and watched-user isolation are detailed in Appendix A3.
The brief archive contains 257 delivered ticker-days. Of those, 236 had a ten-session price when I froze the study. In the current system, code counts distinct Reddit sources, applies the mention and velocity gates, removes avoided tickers, ranks the survivors, and keeps five. Claude receives that table and explains it. Claude does not choose the tickers. More details about this pipeline are in Appendix A4.
From Reddit firehose to 236 analyzed ticker-daysup to five per brief · stage widths are conceptual
For the price check, I used the next session’s open and the later split- and dividend-adjusted close from yfinance, fetched August 29.
Median return by time horizonfrom next-session open
−0.2% −1.7% −2.1% −7.3% −12.5%
1 sessionn=250 · 46.4% positive 3 sessionsn=245 · 44.9% positive 5 sessionsn=243 · 42.4% positive 10 sessionsn=236 · 32.6% positive 15 sessionsn=226 · 29.6% positive
Trading sessions after the brief
Adjusted prices · fetched 2026-08-29
Median returns became more negative at longer horizons.
The ten-session median hides a wide distribution. Twenty events fell by at least half, while two rose above 50 percent. One of those two rose 579.2 percent. Most events, 140 of 236, landed between −25 and +10 percent.
The shape behind the median10-session outcomes · 236 delivered ticker-days
range −88.8% to +579.2% · 2 events sit in the final binschematic normal reference · centered at 0%
140 of 236 events landed between −25% and +10%.
Every dollar chart uses the same fictional ledger. Each row starts with a fresh $1,000 unit at the next session’s open. Buy benefits when the stock rises. Sell is modeled as a short position and benefits when the stock falls. Hold leaves the unit untouched. I subtract $2 from every Buy or Sell result. Hold has no cost. This is a comparison device, not a portfolio simulation.
How the dollar ledger worksone fresh $1,000 unit for every case
The briefs carried attention signals rather than directions, so I tested simple long and short rules on the same rows. Long SPY, an exchange-traded fund that tracks the S&P 500, supplies market context on the same dates. The hindsight oracle is an impossible upper bound because it reads the later price before choosing. The short rule is also purely fictional: it ignores whether the shares could be borrowed and what that borrowing would cost.
10-session dollar histogram236 delivered spikes · fictional $1,000 unit per event
At the default 10-session view, buying every spike lost $19,850, while shorting every spike produced +$18,906 in this fictional ledger. Buying SPY on the same dates lost $756, so the spike result was much larger than the broad-market comparison. The +$52,995 optimal result is a hindsight ceiling. It shows how much movement existed in the sample, not what a live system could have captured.
That made the brief an attention alert, not a stock direction. The DD path went one step further by asking a model to turn an evidence packet into Buy, Hold, or Sell.
I could not treat the briefs and deep dives as one sample. The brief stream is system-selected. A ticker appears because code surfaced it from chatter. The 69 frozen deep dives are user-selected. An authorized Telegram user chose the ticker and asked the bot to investigate it.
The 69 deep dives are not 69 independent stock ideas. They cover 49 tickers. Nine tickers were requested more than once and account for 29 prompts. One ticker appears 11 times. The set also overlaps heavily with the brief stream.
From spike to requestthe paths overlapped, but the selectors were different
This is where the paths meet. A spike meant code said “look here.” A deep dive meant a person picked one ticker and asked a model to judge it.
Appendix A5 follows one privacy-safe synthetic record through each path, from Reddit HTML and untrusted chatter to the saved brief or deep-dive result.
I joined each of the 78 archived deep-dive calls to the next available session’s open. The exit is the 5th, 10th, or 15th session’s close. Every forward-return figure uses the same adjusted Yahoo price file pulled on August 29. These results describe the requested call log, including repeated tickers. They do not describe a random stock sample.
A deep dive began with a person’s choice, not a ranking rule. The user sent /dd $TICKER. A code workflow checked the symbol and assembled the evidence, then Claude chose Buy, Hold, or Sell with a confidence score. The system parsed the answer, rejected any ticker absent from the prompt, saved the call, and sent it through Telegram. The detailed label hit rates and how each one was counted are in Appendix A1.
Who picks a DD ticker?the person picks the ticker · Claude picks the label
I applied the same ledger to every call. Each active label gets the fictional $1,000 unit described above and pays the same $2 cost. The comparison omits capital limits, spreads, slippage, borrow fees, and whether a short was available at all.
“Always short” gives every case a Sell label. “Always long” gives every case a Buy label. “Long SPY” applies the same unit to a broad US stock-market fund. The hindsight oracle checks the later price first. It chooses Buy or Sell(not Hold since it’s the stock rarely stays flat) for the highest net result.
10-session dollar histogram73 gradeable calls · fictional $1,000 unit per active label
At the default 10-session view, always short won the total partly because it acted on all 73 cases. The archived calls acted on only 33. Per active case, the archive averaged +$132.58 versus +$106.84 for always short. Both figures still come from the same small, repeated, bearish sample.
I also asked whether the archive’s label placement beat chance under the same action mix. In 100,000 random reassignments, only 1.24% matched or beat the archived +$4,375 result. This after-the-fact check is not proof of a forecasting edge. Appendix A1 shows the full distribution and its limits. The evaluator audit in Appendix A6 shows how the seven-day average, entry timing, and dates included changed earlier versions of this story.
Saving the exact prompts turned Stockbot’s DD archive into a replayable harness. I ran 29 complete configurations across the same 69 files with retrieval and tools disabled.
Provider and command-line wrappers can still add context around the payload. The archived production row came from Claude’s command-line default at call time. StockBot did not record the resolved model ID. I cannot name the exact Claude snapshot since it ran in a default mode, I should have pinned the model in hindsight. The default may have changed during the archive window.
The chart starts with the 64 prompts that reached a ten-session price. You can use the exit selector to re-score the same calls after 1, 5, 10, or 15 trading sessions. Each thin ribbon preserves the Buy, Hold, and Sell calls in the same earlier-to-later case order; the eligible sample changes to 69, 68, 64, or 56 prompts as the window grows.
Always short remained above every model at +$8,529. The archived Claude-default response reached +$4,338. Claude Opus 4.8 led the lower-leakage-risk group at +$6,210. Claude Opus 5 reached +$6,335 in the hosted sensitivity group. Muse Glimmer led the local group at +$3,720. Those totals matter less than the ribbons beside them. The models took different actions on identical evidence.
Explore the Reddit DD Bench10-session exit · select a bar to inspect its result and call tape
Interactive chart unavailable. The complete sequence table follows in the appendix.
The complete sequence table, agreement audit, output-validation notes, and leakage groupings are in Appendix A7.
No real money moved, and this is not investment advice. Appendix A8 covers related systems, and Appendix A9 lists the repositories used.
The main narrative stops here. The appendix keeps the complete policy table, archived hit rates, random-label comparison, agreement audit, implementation details, sensitivity checks, comparison set, and privacy-safe traces.
I expected the model response to be the important artifact. The database mattered more.
SQLite evidence spineMay 16 through August 28
The archive covers 105 calendar days but only 75 observed local dates. Nine recommendations predated complete call logging. The remaining prompts contain exactly 1,380,422 characters and 69 unique hashes.
A “hit” simply means the later price moved in the direction of the label: up for Buy, down for Sell, or no more than 5 percent either way for Hold. The result that first caught my attention was the Sell row. Buy labels struggled across the same dates.
Archived direction labelshit rate after the next-session-open entry
Hold uses the original ±5 percent range. One call was too recent for the five-session grade when the price file froze, and longer windows leave fewer usable cases. The 15-session Buy rate, for example, is only 4 of 8.
Yes, this is a random-chance comparison with one constraint. I kept the archive’s 11 Buy, 40 Hold, and 22 Sell counts unchanged, then randomly reassigned those labels across the same 73 returns 100,000 times. The question was simple: if the labels had landed on cases at random, how often would this exact action mix have produced at least the archive’s +$4,375 result?
What if the same calls were assigned at random?100,000 shuffles · 11 Buy, 40 Hold, and 22 Sell every time
That makes the archived placement unusual in
正文由 探How 从来源站点 RSS 同步,内容未经改写;遇到排版缺失或需要图片、视频时请以原文为准。