VictoriaLogs vs. Loki, Elasticsearch, OpenSearch, SigNoz and ClickStack
At VictoriaMetrics, we constantly benchmark our products. This helps us stay competitive and make every release better. As VictoriaLogs reaches more teams, more of them ask us which use cases it fits, and what they woul…
以下正文同步自 Hacker News 最新,版权归原站所有,已转换为易读排版。
At VictoriaMetrics, we constantly benchmark our products. This helps us stay competitive and make every release better. As VictoriaLogs reaches more teams, more of them ask us which use cases it fits, and what they would gain by switching to it. So we publish our benchmark as a public repository that anyone can run to reproduce our results, and we will keep developing it in the open.
This is not a marketing post that tells you to switch to VictoriaLogs in every case. Instead, if you collect structured logs, from Kubernetes or anywhere else, it should help you choose the right tool, with the trade-offs that suit you.
Benchmarks that compare systems are always controversial, because each system is good at different use cases. This post only tests one case, ingesting structured logs, where every line has named fields, as many services on Kubernetes write them. Each system runs on one machine of the same size. Query performance, cluster mode and object storage will come in later posts.
Ingestion speed alone does not tell you which system to choose, so this post also looks into their internals:
The answers help you plan hardware and costs, and avoid surprises as your logs grow.
We test recent releases of 6 systems as of October 2026, with settings close to their defaults:
We changed a few settings so that each system can reach the limit of its design on one node, such as Loki’s ingestion limits. VictoriaLogs needed no changes, because it is designed to give its best performance out of the box (docs). The repository explains every change.
To keep the test simple, each system runs in single-node mode on its own Kubernetes node (n2d-standard-8 on GCP, with 8 vCPUs and 32 GB of RAM). SigNoz and ClickStack store logs in ClickHouse, which cannot receive logs from log shippers on its own. So each stack runs its own collector, built on the OpenTelemetry collector, on the same node as ClickHouse.
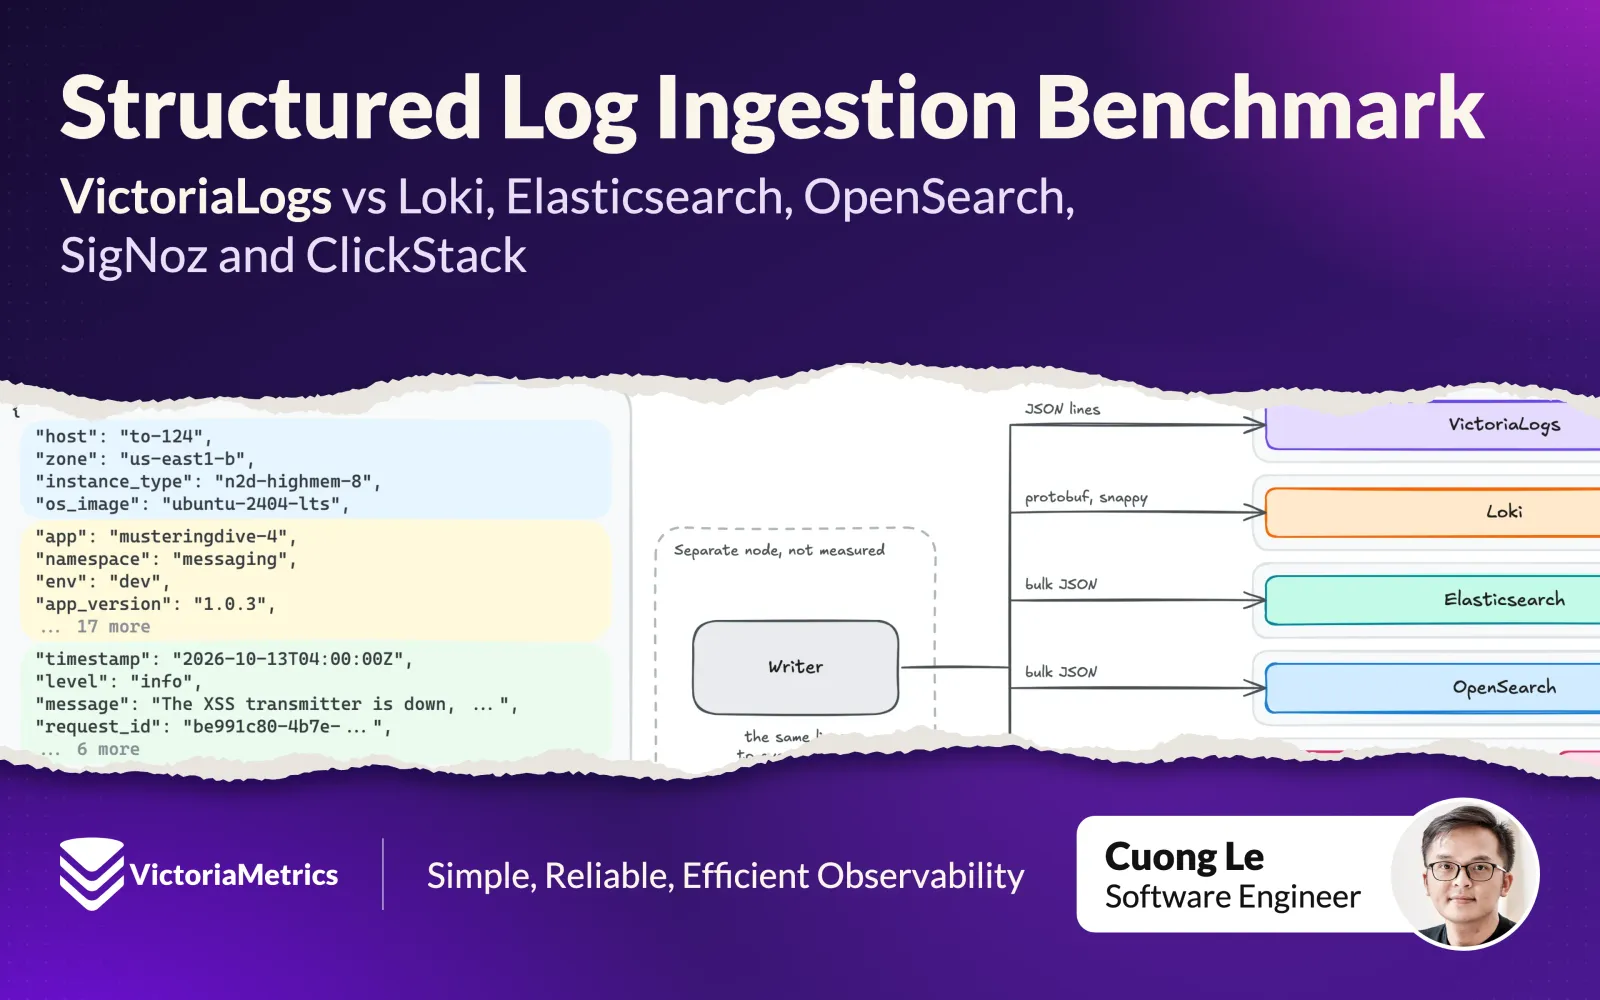
The test setup: one writer sends the same logs to 6 systems.
We send the same logs to every system at the same time. The rate starts at 10k lines/s and goes up by 10k every 10 minutes, up to 180k lines/s. The maximum ingestion rate of a system is the highest rate it stored, averaged over a full 10-minute step. If a system crashes, we only count the steps before its first crash, since a crash is its limit.
We count the lines that each system stored, not the ones it accepted. SigNoz and ClickStack, for example, answer as soon as their collector receives the lines, so a collector crash loses lines that were already accepted. Loki is the exception. It has no cheap way to count its stored lines, but it writes every line to its write-ahead log before it answers, so for Loki we count the accepted lines.
The ingestion rate is only half of the story. To show how it relates to query speed, we loaded VictoriaLogs, Elasticsearch and Loki with the same logs at 35k lines/s for 4 hours, and then timed a few common queries on them with cold caches. We will look at queries in depth in a later post.
Logs can be anything from plain text to wide events with hundreds of fields. This test picks the middle, a structured log line with 30 to 40 fields, which is typical for Kubernetes. The app writes about 20 to 30 of these fields, and the log shipper adds about 10 more, such as the namespace, node and labels.
Picture a Kubernetes cluster of 125 nodes, where each node runs 40 pods of different apps. The logs of each pod form one log stream, so this cluster has 5,000 log streams. It is a mid-sized cluster, similar to many that we see among VictoriaLogs users.
One log line of the test, with its fields grouped by how often they change.
We want to see how far each system can go with its own design. So each system receives the logs in its preferred format. For example, Loki usually receives protobuf from Grafana Alloy. We do not send the same format, such as OTLP, to every system. If we did, we would also measure how well each system converts that format, not only how it stores logs.
In practice, logs often start as JSON on stdout. So a log shipper has to convert them, and this also costs CPU. If enough readers ask for it, we can also run the test with one common format, such as JSON or OTLP.
We ran the main ingestion test 3 times, and the results below are the median of the 3 runs. The full tables are in the repository.
For SigNoz and ClickStack, the CPU and memory include the collector, ClickHouse and their helper services.
The few extra tests that we mention in this post, such as the queries, are one-off runs outside the repository.
One line is about 930 bytes of JSON, so 120k lines/s is about 106 MiB/s, or about 9 TiB of raw logs per day.
Each of these numbers comes with a trade-off in query speed, cost or the type of logs. We explain them in Why the results look this way.
Average CPU cores at each ingestion rate. Each line ends at the system’s maximum ingestion rate.
CPU was the limit for most systems in this test.
Peak memory at each ingestion rate, without the OS page cache. A line ends at the last rate that the system kept up with.
Memory decides how big, and how expensive, the machine must be, and how much is left for caching and queries.
This chart shows how much disk each system needs for one million log lines. As a reference, one million lines take about 887 MiB as raw JSON. SigNoz is N/A because its collector kept crashing, so it stored too few lines, and its numbers changed too much between runs to compare.
Logs are often kept for weeks, so the disk space grows quickly. For example, 30 days of logs at 50k lines/s take about 7 TiB in VictoriaLogs, 12 TiB in Loki and 33 TiB in Elasticsearch.
This table shows how many bytes each system writes to disk for each line it stores. This is more than the final size on disk, because each system rewrites its data from time to time to keep it compact and fast to search. N/A means that the system could not keep up with that rate.
VictoriaLogs also wrote the least to disk per line, and even less at higher rates, because it compresses better when it writes more lines at once. Loki wrote 3x to 7x more per line, depending on the rate.
This matters because every disk has a limit on how many bytes it can write per second, and faster disks cost more. In our test, we used 500 GiB pd-balanced disks on GCP, which can write up to 280 MiB/s, so no system reached that limit before it ran out of CPU. Still, VictoriaLogs lets you use cheaper disks, and on your own hardware, it wears out your SSDs much more slowly.
Loki’s high ingestion rate surprised us, but its design explains it. Loki is built to store a lot of logs and later read a few streams over a short time range. So it only indexes the stream labels (here, node and app), and stores each line as is. In contrast, VictoriaLogs splits every line into fields and stores each field separately, so queries are faster later. This costs about 18% more CPU than Loki at 120k lines/s.
How you send logs to Loki matters too. Grafana Alloy and Vector send protobuf by default, but Fluent Bit, Fluentd and Logstash send JSON. With JSON, Loki reached about 99k lines/s in a separate run, below VictoriaLogs, because handling JSON costs it much more CPU than protobuf. So if you run Loki, prefer Alloy or Vector.
Loki’s design has 3 costs. The first cost is memory. Loki keeps the newest lines of every stream in memory, so it can compress them together. This means its memory grows with the number of streams. You get more streams in a bigger cluster, or in any cluster during a deployment, since every new pod starts a new stream. To see how much memory this takes, we also ran the test with 10,000 and 15,000 streams.
Loki and VictoriaLogs with 5,000, 10,000 and 15,000 streams.
With 15,000 streams, Loki ran out of memory at 60k lines/s and was killed. VictoriaLogs needed only 0.2 GiB more with 3 times the streams. More memory means a bigger machine, and less memory left to cache data for queries.
The second cost is disk. Loki compresses the lines as plain text. It does not use the fields inside the lines to compress them better, as VictoriaLogs and ClickHouse do, so it needs 1.8x more disk than VictoriaLogs.
The third cost, which matters most, is query time. Loki can only narrow a query down by its labels. Anything else, a word or a field value, means decompressing and scanning every line of the matching streams. On the same logs, the queries from the setup took this long.
These are everyday questions when you investigate an incident or build dashboards and alerts. Loki took half a minute or more on all of them except the first, or refused to answer. The first query reads only one app through its labels, and even that was almost 60x slower than in VictoriaLogs.
Loki is adding ways to search fields faster, such as bloom filters, but they are still experimental, off by default and not available on a single node, so we left them off.
These slow queries do not make Loki a poor choice for logs in general. It is built to keep logs cheap in object storage, and to scale out over many query workers when you need to run large queries. On our single machine, it took 171 seconds to count the errors of every app in one hour, using about half of the 8 cores. By a rough estimate, to answer in about 2 seconds, the same scan would need about 300 cores. So Loki suits you if you want to store a lot of logs cheaply in object storage, and either read only a small part of them or can pay for many cores to search them fast.
If that is more than you want to pay, and you still need dashboards and searches to answer in seconds, read on.
OpenSearch is a fork of Elasticsearch, so this section mainly covers Elasticsearch and ends with how OpenSearch differs.
Loki indexes almost nothing and pays for it at query time. Elasticsearch does the opposite. It stores every line in 3 forms:
All this makes ingestion expensive. At 40k lines/s, Elasticsearch used 5.2 cores, against 1.6 for VictoriaLogs and Loki, and it ran out of CPU at about 48k lines/s. The limit was CPU, not disk. Elasticsearch writes every request to disk before it answers, but when we turned this off in a separate run, the rate stayed about the same.
Our test used LogsDB, Elasticsearch’s newer and more compact index mode for logs. But Elasticsearch still used 2.6x more disk than Loki and almost 5x more than VictoriaLogs.
In return, Elasticsearch is much faster at finding things than Loki. On the queries where Loki took minutes, Elasticsearch answered in seconds or less. Here is how it compares with VictoriaLogs on a few common kinds of queries.
Elasticsearch finds a single word or value almost instantly, and it is also faster on simple counts, such as the errors of every app. A phrase, such as “connection timeout”, took it about 3 minutes.
To save disk, its default setup for logs does not store where each word sits in a line, so it has to reread the lines to see whether the two words are side by side. VictoriaLogs is faster there, and on percentiles and top values.
Elasticsearch is popular because it can search any field fast. The usual complaints are about 2 things.
Uber had both problems. Indexing was expensive, and Uber ran more than 20 clusters per region, so that one failed cluster would not break everything (Uber). Cloudflare had to sample some of its logs because storing all of them took hundreds of terabytes (Cloudflare). Both moved some of their largest log workloads to ClickHouse.
OpenSearch ingested a bit more than half as much as Elasticsearch (28k against 48k lines/s) and used about twice as much disk. It differs from Elasticsearch in 2 defaults.
OpenSearch shares the same core as Elasticsearch, so you can likely close much of the gap with stronger compression, sorting and a full template for logs. We kept it close to its defaults on purpose, to show what you get out of the box.
Loki makes ingestion fast at the cost of quer
正文由 探How 从来源站点 RSS 同步,内容未经改写;遇到排版缺失或需要图片、视频时请以原文为准。