Ontology-Driven Observability: Building an End-to-End Knowledge Graph at Netflix Scale
Prasanna Vijayanathan, Renzo Sanchez-Silva When Jake Paul and Mike Tyson stepped into the ring in November 2024, we delivered the fight to roughly 65 million concurrent streams. On an ordinary day our infrastructure tak…
以下正文同步自 Netflix TechBlog,版权归原站所有,已转换为易读排版。
Prasanna Vijayanathan, Renzo Sanchez-Silva When Jake Paul and Mike Tyson stepped into the ring in November 2024, we delivered the fight to roughly 65 million concurrent streams. On an ordinary day our infrastructure takes in more than 2 billion requests and handles upwards of 38 million real-time logging events every second. At that scale, the whole picture doesn’t fit into a single engineering team’s head or onto a single dashboard. With more Live content, Podcasts and real-time streams, our need to understand and update our systems as quickly as possible becomes imperative to provide a good user experience. Understanding the system at this scale and within the time constraints we have, often becomes a daunting exercise in finding a needle in a haystack, in a dark jungle, blindfolded. This post is about that search for the needle.
The Four hours before a fix
Consider a regression of the kind we see in a given week. The home screen where you see the list of lists of movies, starts taking about 1.5 seconds longer to render. An alert fires. And then we go looking for what caused this issue and how do we fix it? As it so happens, a regression on the application could be related to anywhere in the system — a client app regression from a new version deployment or A/B test rollout, a load shedding in the infrastructure, a GraphQL query responding with bad data because of a service rollout 6 hops downstream, are all suspects at this point. So, answering “what caused the issue?” needs insights from across the system, and this involves combing through layers of data in a meticulous manner.
The MELT Layer
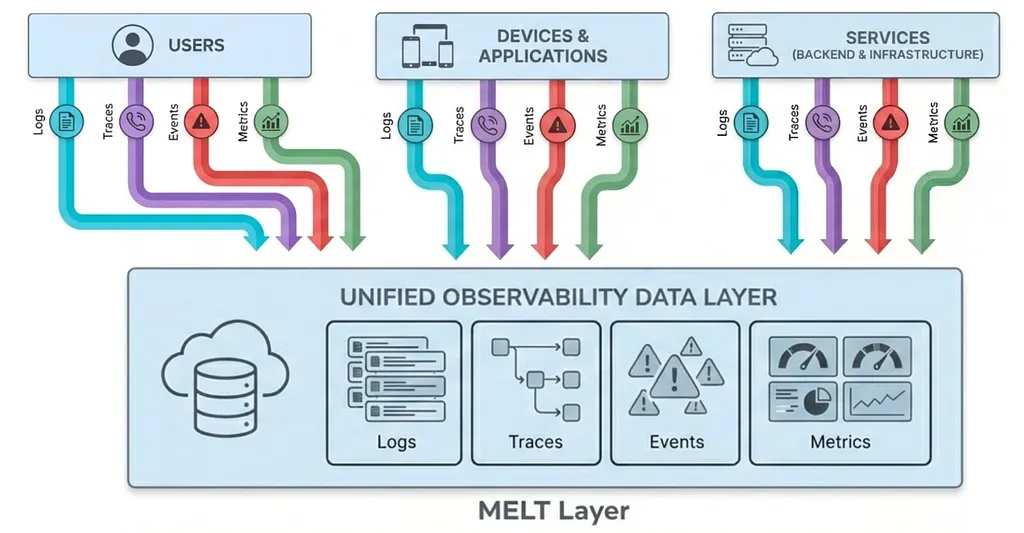
“What caused the issue?” Metrics, events, logs and traces, or MELT, in the industry’s shorthand, are the right raw materials for such an investigation, and each of them answers roughly a quarter of the question. We collect observability data across these four pillars, unified into a single observability data layer. This lets us observe our systems in real time, across what our users are experiencing, how our applications are doing and what our backend infrastructure and services are processing and responding to. MELT — Metrics, Events, Logs and Traces, and how they are captured across the system. The investigation that follows may look like this in each layer: What each layer of MELT tells us and what it leaves out
The timeline of an investigation
So how long does it take to investigate an issue, figure out the root cause and fix it, so our users stop running into this issue again? A timeline of an investigation: ~4 hours In our chosen example, four hours. Very little of it went into computing anything difficult. Most of it went into reconstructing relationships that our observability systems already knew but we had never written down anywhere a human or machine could simply read and discover.
The disagreement underneath
The instinct here could have been, around 2023, to reach for more data or better dashboards, and while both help at the margins, neither addresses what makes these investigations slow. It’s 2026 now, so we might say, “hey, agents”, but without the right context delivered to the agents, AI systems hallucinate, and especially when teams are on-call and need a fix “now”, we cannot let inaccurate agentic analysis lead us down the wrong path. We need the right needle, not any needle. Each of our systems is internally coherent and externally isolated. Atlas, our telemetry platform, knows applications and their time series. Radar, our alerting system, knows thresholds and firing history. incident.io knows severities and responders. PagerDuty knows rotations. Spinnaker knows what shipped and when. And our Slack history knows, in a form no query engine can reach, which engineer solved something very similar last quarter and what they found. The difficulty is that they do not agree on what they are talking about. A thing that is an application in one system is a service in a second and a cluster in a third, with names differing by a suffix, a casing convention, or a rename only a couple of people remember (SMEs, ring a bell?). Joining across them requires a human carrying the mapping in their head, and that person becomes the bottleneck in such cross-domain investigations. The hard part of end-to-end observability is probably better understood as a data modelling problem. What we lacked was an explicit, machine-readable agreement about the entities in our operational world.
The Ontology
This agreement has a name: an ontology. Ontology is a formal specification of types, the properties they carry, and the relationships they may have. Its unit is the triple, one fact expressed as subject, predicate, object. Consider the following example triples.
api-gateway rdf:type ops:Application .api-gateway ops:ownedBy "Team Bedrock" .api-gateway ops:deployedIn "us-east-1" .INC-5377 rdf:type ops:Incident .INC-5377 ops:affects api-gateway .INC-5377 ops:severity "SEV 2" .
In the example here, we have already encoded six facts, and can answer in one query, a question that used to span three tools. “Which incidents affected applications owned by Team Bedrock in us-east-1?” is a single query in place of looking up incidents, Spinnaker and Radar. We call our ontology layer, The Observability Ontology. It acts as the schema, rule set and shared agreement that standardizes how different systems understand entities like applications, services, incidents, deployments, etc. We built it on the W3C stack for this: RDF for the data model, OWL for the ontology, SHACL for validation, and SPARQL for querying. These standards are well specified and widely implemented, which keeps the model portable across graph stores. The data from the ontology itself, is stored as a knowledge graph, persisted to QuipuDB, our homegrown RDF graph database, a distributed quad store based on redb, a Rust-based embedded key value db. Data here is generated by parsing raw telemetry, logs, and incident discussions into triples (subject-predicate-object facts). Every harvest also produces a full Turtle serialization for archival, making it human-readable and diff-friendly, which has proven more useful for debugging than we expected. Our ontology is organized into twelve namespaces, each owning one operational domain: There are two decisions about this ontology that mattered while we built it, so they’re worth sharing. The first is that we refused a generic Service type. “Service” means four different things across our tooling, so applications resolve to exactly one type, ops:Application, and every one of them is validated against our software catalog of roughly 49,000 entries before the entity is created. Unvalidated strings like usernames, team names, dependency names scraped from network topology, never become applications. We also cap dependency edges in both directions, because one popular service can carry thousands of reverse dependencies and would otherwise dominate the graph. The second decision concerns what we chose to model. Incident chat carries the reasoning behind an incident. The hypotheses tried and discarded, the mitigation that worked, who knew why, is all context in the incident’s Slack channel and that knowledge evaporates when the channel goes quiet. So a 200-message, 50-person, 15-service incident channel becomes a structure, converting the operational chaos of an incident into ordered triples:
Creating determinism from non-determinism
Building this graph means using tools that are inherently stochastic. LLMs summarize discussions. Fuzzy matching resolves service names. A probabilistic engine proposes causal chains. None of these produce the same output twice with certainty, but what comes out at the end of our system is a deterministic graph that answers a SPARQL query the same way every time. The ontology is the mechanism that creates this determinism through its pipelined approach. We think of the pipeline as a ladder that drives entropy down, where entropy means the proportion of information still trapped in unstructured form. For example, at the start of this pipeline, an LLM could say anything, but it cannot emit a triple that violates the type system. We constrain the output space tightly enough and a stochastic process yields a deterministic contract:
# The model may produce any prose. Its output MUST fit these predicates:category IN ["incident", "question", "discussion", "decision"]sentiment IN ["positive", "neutral", "negative", "urgent"]# Result — a deterministic triple:thread:123 slack:category "incident" .thread:123 slack:isIncidentRelated "true"^^xsd:boolean .
There are five layers that get us down this ladder. Any single step of this ladder is non-deterministic. But in aggregate, the chain becomes deterministic. That inversion is the whole trick. We describe them below: The five layers to create determinism from non-determinism
Enrichers: Agents as entropy reducers
We use what we call, enrichers, to reduce entropy across the knowledge graph. Dozens of enrichers run over the graph. Each one of them takes noisy input and emits typed triples, and each reads what earlier enrichers wrote. The contract for an Enricher is deliberately narrow:
class Enricher: async def _enrich_async(self, ...): raw = await self.fetch(...) # 1. read noisy input result = self.analyze(raw) # 2. process (may be stochastic) graph.add((uri, RDF.type, OPS.X)) # 3. emit TYPED triples graph.add((uri, OPS.pred, Literal(result.value))) return EnrichmentResult(success=True, triples_added=count)
Three invariants that are standard across the enrichers:
- every entity carries an rdf:type,
- every URI follows a single naming scheme, and
- the catalog gates every ops:Application. Two operational choices are worth naming here, as well. The enrichment pipeline runs sequentially — load the graph, add triples, and save. This sequencing removes an entire category of race conditions at a cost in wall-clock time we are happy to pay. And calls out to external systems like metrics, logs, events and the rest could be best-effort, so a slow downstream API doesn’t block the graph harvest, albeit some degradation. To that end, we are also working to translate these separate systems into the ontology, such as the Metrics Ontology and the Alerts Ontology, so everything could be queried from the Ontology itself.
The Correlation Engine: finding the correlation chains
The correlation engine assimilates the vast number of signals from diverse input sources and condenses them into causal or correlatory chains of events. Today, the engine reads thirteen signal types, including log errors, metric anomalies, slow and failed traces, alerts, incidents, deployments, config changes, experiments, autoscaling, commits, end-to-end bottlenecks, and error patterns. It then searches for paths among them. Some ordered pairs are known to be causal and carry a high prior weight. For example, deployment before log error, config change before metric anomaly, failed trace before incident, and so on. Others, which show high correlation are considered correlation chains. Such chains are scored on temporal proximity and severity, inside a ten-minute window, with anything under 0.6 confidence getting discarded. The Correlation Engine The role of the engine here is to propose with evidence, not to make conclusions. Hence, the engine stores its chains along with the graph records that were used to create them. A 0.87 chain in the above example, is a strong hypothesis for a human or an agent to check, and the graph records the confidence alongside the claim so that consumers can understand why a chain is what it is and weigh their options to make decisions.
The knowledge flywheel
Each harvest cycle turns the same four steps, and each rotation leaves the graph richer for the next. This is the Knowledge F
正文由 探How 从来源站点 RSS 同步,内容未经改写;遇到排版缺失或需要图片、视频时请以原文为准。