Predicting Driver Standings for the 2026 F1 Season from 40 seasons of data
Predicting Driver Standings for the 2026 F1 Season from 40 seasons of data
以下正文同步自 Hacker News 最新,版权归原站所有,已转换为易读排版。
Sports Predictions
Forecasting
Regression
Feature Engineering
Predicting Driver Standings for the 2026 F1 Season from 40 seasons of data
Karan Singh
5 min read·
Aug 28, 2026
--
Disclaimer: This project is strictly for educational, research, and data science purposes. It does not promote, facilitate, or encourage sports betting, wagering, or online money games. The predictions and models shared here are purely analytical and should not be used as financial or gambling advice.
I was a regular follower of F1 during the Schumacher-Barichello-Raikonnen-Montoya era of the early 2000s. In recent years, my interest in F1 seems to have resurfaced. When I saw the Formula1 Complete History dataset on Kaggle, I thought it would be interesting to do something with it.
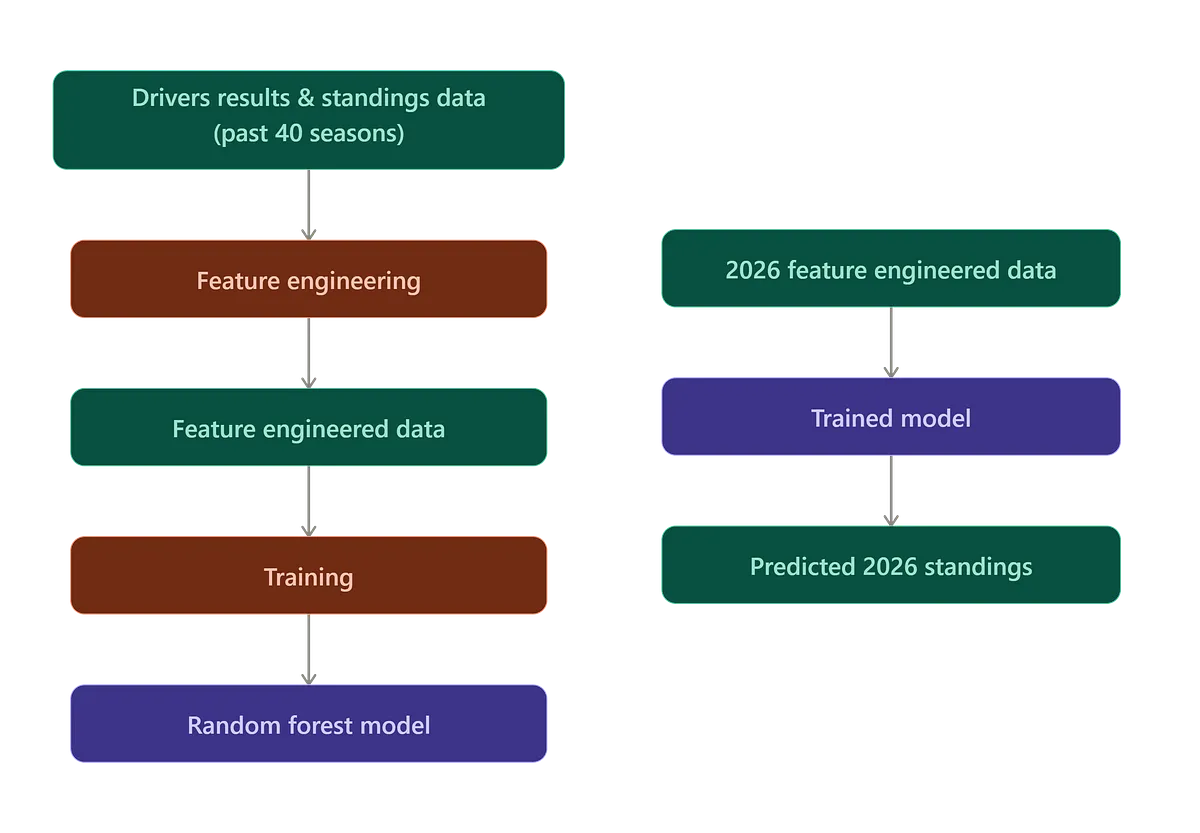
The dataset includes driver results for each F1 race since 1950, as well as the season’s final standings. To predict a season’s final driver standings, we can use the race results data available till a certain round. In this post, we aim to predict final standings for the 2026 season using results available up to the most recent race — the Hungarian Grand Prix (as of 3rd August 2026).
We train a RandomForestRegressor model using results up to the 11th Grand Prix of each season to predict the season’s final driver standings.
The main motivation, other than the domain being super interesting, was to do a project involving some form of feature engineering. In this project, I generate features based on a driver’s performance in this season and the last few seasons.
The data used in this project is sourced from the Jopica API, licensed under CC BY-NC-SA 4.0, and Formula 1 Complete History (1950–2026) on Kaggle (By Rishi Patel), licensed under CC BY 4.0. See my GitHub repo for details on modifications made.
Let’s take a look at the results data (specifically the top finishing drivers for the 2025 Las Vegas Grand Prix)
Hmmm nice. Here, the “grid” column denotes the starting grid position after qualifying.
Now let’s look at the file which contains the final driver standings for a season.
We’ll be using these 2 files to generate our training data.
Let’s generate features for all drivers in our dataset. We’ll create 2 types of features, for each (driver, season) pair:
Current Season Features (up to N=11 races):
Here is an example of these features for some drivers for the 2025 season:
“wins” is used in its original form from the dataset.
To predict the final position, we add the actual end-of-season position for each driver and season as our target variable.
As we can see, the avg_grid_position (a proxy for qualifying performance) is the most informative feature, aboveavg_points (an indicator of race performance). In general, poor starts from good grid positions seem to balance out over the season, and good qualifying performance leads to higher points in the race.
We use a time-based split with an 80–20 ratio for training and validation datasets (training on earlier seasons and validating on more recent ones). Later, we’ll test our model on the 2026 drivers dataset.
Train and Evaluate Random Forest Regressor
We evaluate our model’s performance using Mean Absolute Error (MAE) and R-squared score. MAE gives us an idea of the average magnitude of errors, while R-squared score indicates how well the model explains the variance in the target variable.
model = RandomForestRegressor(n_estimators=100, random_state=42) model.fit(X_train, y_train)
y_pred = model.predict(X_eval) mae = mean_absolute_error(y_eval, y_pred) r2 = r2_score(y_eval, y_pred)
print(f"Mean Absolute Error (MAE): {mae:.2f}") print(f"R-squared (R2): {r2:.2f}")
Mean Absolute Error (MAE): 1.60 R-squared (R2): 0.86
Feature Importances
Press enter or click to view image in full size
Our model uses grid positions, which we previously found to have the greatest predictive power for final standing. The only other feature it utilizes significantly is the average points this season.
We can vary N, i.e., the number of current-season race results, to assess the predictability of our data. In addition, let's consider a baseline model that only predicts drivers' positions at the end of those N races (note that this data was not added as an input feature to our model)
Let's plot the MAE and R-squared error for the baseline and our model
Press enter or click to view image in full size
As can be seen, our model performs better with regard to MAE up to N = 8 and to R-squared up to N = 10.
In addition, the model metrics show a relatively sharp change from race 1 to 3, and then plateau. This indicates that subsequent race results do not significantly improve predictions of the final standings, and our model relies largely on race results till the 3rd race.
It’s interesting to see the Average Gain/Loss in position from qualifying to the race for the current season’s drivers over their careers. Here, we consider only drivers who have participated in more than 50 races in their careers.
Lance Stroll tends to have the highest jump in position, while Leclerc and Piastri are notable underperformers compared to their grid positions.
I hope you enjoyed reading this article. Please leave your comments below. I’d like to hear your thoughts on what other predictive analysis could be done using this dataset.
正文由 探How 从来源站点 RSS 同步,内容未经改写;遇到排版缺失或需要图片、视频时请以原文为准。