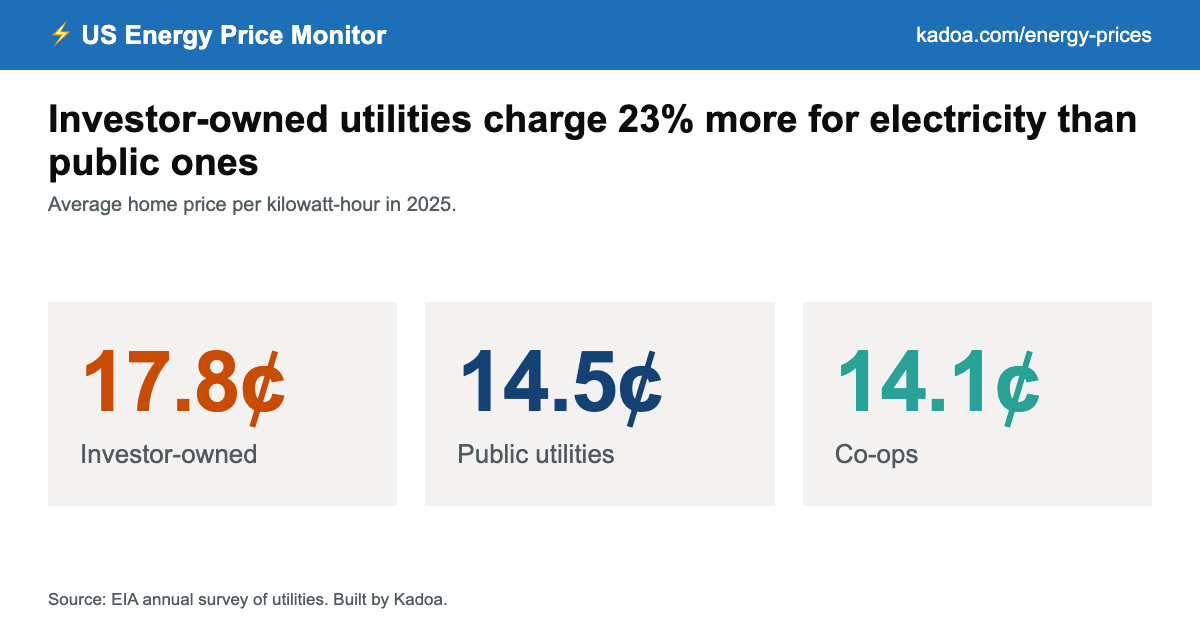
Investor-owned utilities charge 23% more for electricity than public providers
In 2025, homes paid 17.8¢ a kilowatt-hour at investor-owned utilities, 14.5¢ at public utilities and 14.1¢ at co-ops. Since 2020, investor-owned prices rose 34% and public ones 19%, against 24% inflation.
以下正文同步自 Hacker News,版权归原站所有,已转换为易读排版。
In 2025, homes paid 17.8¢ a kilowatt-hour at investor-owned utilities, 14.5¢ at public utilities and 14.1¢ at co-ops. Since 2020, investor-owned prices rose 34% and public ones 19%, against 24% inflation.
Change since 2020 against inflation, or cents per kilowatt-hour since 2015.
Every year since 2015: home revenue, kWh sold, homes, price and bill by utility owner, for the US and each state, as a gzipped CSV.
Source: EIA annual survey of utilities (Form 861), homes buying supply and delivery from their utility; BLS CPI.
Share of homes by their utility's average price per kilowatt-hour, in 2-cent bands.
Source: EIA annual survey of utilities (Form 861), homes buying supply and delivery from their utility.
Investor-owned prices rose faster than nonprofit (public and co-op) prices in 38 of the 48 states with both: investor-owned against nonprofit.
Source: EIA annual survey of utilities (Form 861), homes buying supply and delivery from their utility.
Change in the average home price at utilities with 250,000 or more homes: investor-owned, public and co-op.
Source: EIA annual survey of utilities (Form 861), homes buying supply and delivery from their utility; BLS CPI.
正文由 探How 从来源站点 RSS 同步,内容未经改写;遇到排版缺失或需要图片、视频时请以原文为准。