State of the Prompt: What People Ask AI
Rutgers University · School of Communication and Information
以下正文同步自 Hacker News 最新,版权归原站所有,已转换为易读排版。
Rutgers University · School of Communication and Information
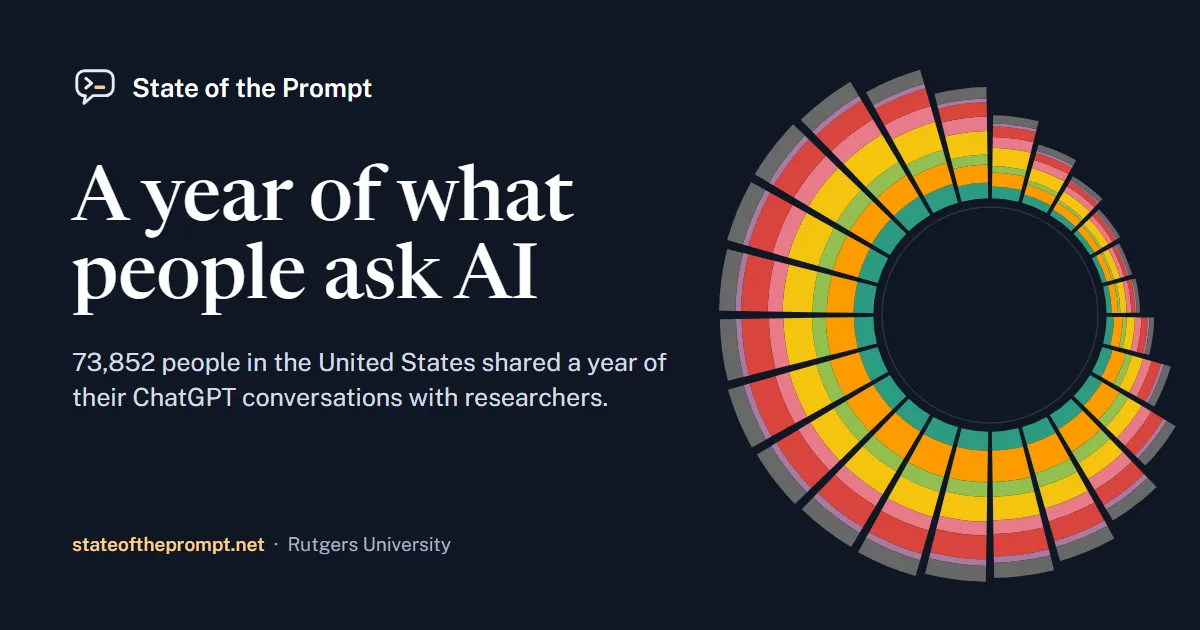
An opt-in panel of 73,852 people in the United States shared their ChatGPT conversations with researchers for twelve months. We study what they asked, who asked it, and when.
Each wedge is one hour of the day, in the panelist’s local time; its length is that hour’s share of the day’s conversations.
Type a question in plain words. The answer is written in your browser from published totals, and no conversation is ever shown.
One conversation in ten is mainly about health and medicine, ahead of work and of making images.
Questions about schoolwork climb in late August, dip at Thanksgiving, fall by half over winter break, and fade again in the summer.
Work questions peak in the middle of the morning, at about one conversation in nine. Health peaks around 5 and 6 am, at about one in eight.
Each line is a subject’s weekly share of conversations against its own yearly average. School follows the school calendar, sports follow the big games, and politics follows the news.
Swipe sideways to see the whole year; tap the chart to read a week.
Each square is one in every hundred conversations, colored by the category of its main subject.
A language model read the person’s side of each conversation and named its main subject from a list of 28. The squares group those subjects into seven categories, plus one for conversations whose subject was unclear or not on the list.
Choose a category to see what it holds, or compare groups of people in the dashboard.
正文由 探How 从来源站点 RSS 同步,内容未经改写;遇到排版缺失或需要图片、视频时请以原文为准。