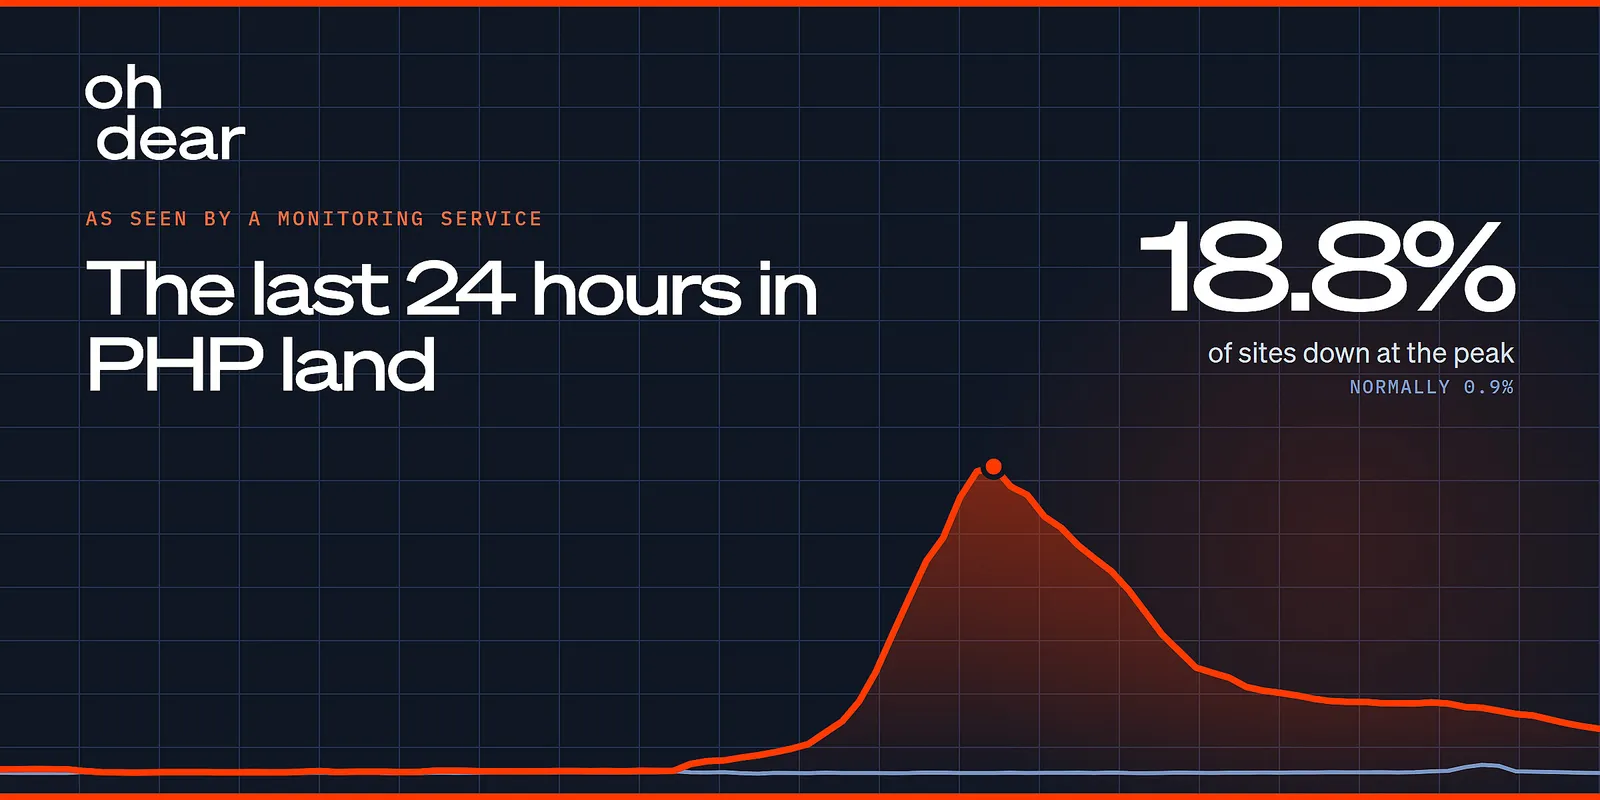
The last 24 hours in PHP land, as observed by a monitoring service
The last 24 hours in PHP land, as observed by a monitoring service
以下正文同步自 Hacker News 最新,版权归原站所有,已转换为易读排版。
The last 24 hours in PHP land, as observed by a monitoring service
Published on October 22, 2026 by Mattias Geniar
The last 24 hours have been interesting in PHP land, to say the least. What started as a responsible disclosure of 2 highly critical vulnerabilities discovered in PHP core turned into a race to find & exploit the vulnerabilities before the official patches were released.
As a precaution, many PHP site owners decided to take down their applications until the official patches were out. All to protect their servers & customer data from being exploited.
Now that all the patches are available and (hopefully!) most people have patched their systems, applications are coming back online.
Below is a series of graphs of what we observed on the websites we monitor for our clients. Given our background in the PHP community, it's no surprise a majority of the sites we monitor end up being written in PHP.
It's our job to alert when sites go down, but we haven't seen this many go down at the same time. Below are our baseline numbers compared to the last 48 hours, where at the peak, 18.8% of the sites we monitored were offline.
Of course, it's our job to alert/notify the ones responsible for those sites, so we sent out alerts. A lot of them. At the peak, 25x more sites got a down alert than in a normal half hour.
Counts sites, not messages. "Normal" is the average half hour of the week before.
And what goes down must come up. While we repeat notifications for downtime as the issue persists, every downtime alert is also followed by a recovery alert.
Looking at the status codes, it's interesting to see how most sites were brought offline. It's a mix of HTTP/503 responses and sites that were completely unresponsive.
So either sysadmins took php-fpm down but let Nginx/Apache still serve requests, or they took the entire web server offline instead.
We did something similar: for a brief period, the Oh Dear website & dashboard were unavailable, as we set up a static HTML page served by Nginx, while keeping our php-fpm stopped.
Of the sites that were down, 7.7% answered 503 before the rise. At the peak it was 43.4%.
Some sites were quick to jump into action and took their sites down for several hours. Others were more relaxed and only took their sites offline a few hours before the patches were due to be released.
Outages under 5 minutes are left out: 30.4% of sites had one, against 24.1% the week before. A site with several outages counts once in each length it had. "Still down" means still down when the 48 hours ended, on 22 October at 09:00 UTC. The week before is judged the same way.
It'll be no surprise that most of the notifications we sent were in the "Your site is down" category. Downtime is anything that isn't an HTTP/2xx code (or that fails the optional checkstring or header verification), so any HTTP/503 or timeout will trigger these notifications.
Counts delivered messages. One outage that alerts three channels counts three times.
The Server header also tells us who answered with the 503. Most often - again, no surprise - this was Cloudflare. They were also quick to add a WAF rule for all clients, mitigating the attack for those that didn't take their sites offline preventively.
Read from the Server header of the failed check closest to the start of the outage. It names the server or CDN that answered, not the application behind it.
Suffice it to say, the past 24 hours were a rush. While the peak seems to be behind us, many sites are still down as they await patches, and we haven't seen a return to baseline yet. We'll keep updating this blog post over the next few days to show the final results in these graphs.
正文由 探How 从来源站点 RSS 同步,内容未经改写;遇到排版缺失或需要图片、视频时请以原文为准。