From 40 seconds to under 10: rebuilding incident detection on OpenTelemetry, Apache Kafka, and Apache Flink on Kubernetes
Every SaaS company has the same uncomfortable question after a major incident: who noticed first, the monitoring or the customers? For a long time our honest answer was “it depends”. This post describes how a small...
以下正文同步自 CNCF Blog,版权归原站所有,已转换为易读排版。
Every SaaS company has the same uncomfortable question after a major incident: who noticed first, the monitoring or the customers? For a long time our honest answer was “it depends”. This post describes how a small team rebuilt the detection platform behind our automated incident creation (“AutoHOT”, where HOT is our internal name for a high-severity incident) on Apache Kafka, Apache Flink on Kubernetes and OpenTelemetry, what we measured month by month for eighteen months, and what we would do differently. It is not a success story with a bow on it. In-scope recall went from about 60% to a peak of 86%, then fell back to 64% in a bad month. Precision is still below where we want it. We think the numbers are more useful than the slogans. The use case We run more than ten cloud products for millions of tenants. Each product emits client-side operational telemetry for every user action: an event when a task starts, and one when it succeeds, fails or is abandoned, tagged with tenant, user, the named “experience” (view issue, edit page, view board) and the HTTP status. Across all products, there are billions of events a day, and it is the closest thing we have to ground truth about whether customers can actually do their work. The job of central monitoring is to turn that stream into three answers, fast:
- Is something wrong? An error rate or a volume drop that a human would call an incident.
- How big is it? Distinct users and tenants impacted, and where: which tenant, database shard, region, or globally.
- Who should be woken up, at what severity, with what evidence? The first-generation system did this with a Node.js aggregator fed from the event bus through a cloud queue, with an in-memory cache for de-duplication and task pairing, running on roughly 90 virtual machines. It worked, and it taught us the domain. It also had three problems we could not tune away:
- Latency. Event-to-metric took more than 40 seconds on a good day. Detectors then needed several minutes of windowed data on top of that.
- Noisy neighbours. The queue was shared infrastructure. Two incidents in one year were caused by another tenant’s lag on the same queue, which is a bad property for the system that is supposed to detect incidents.
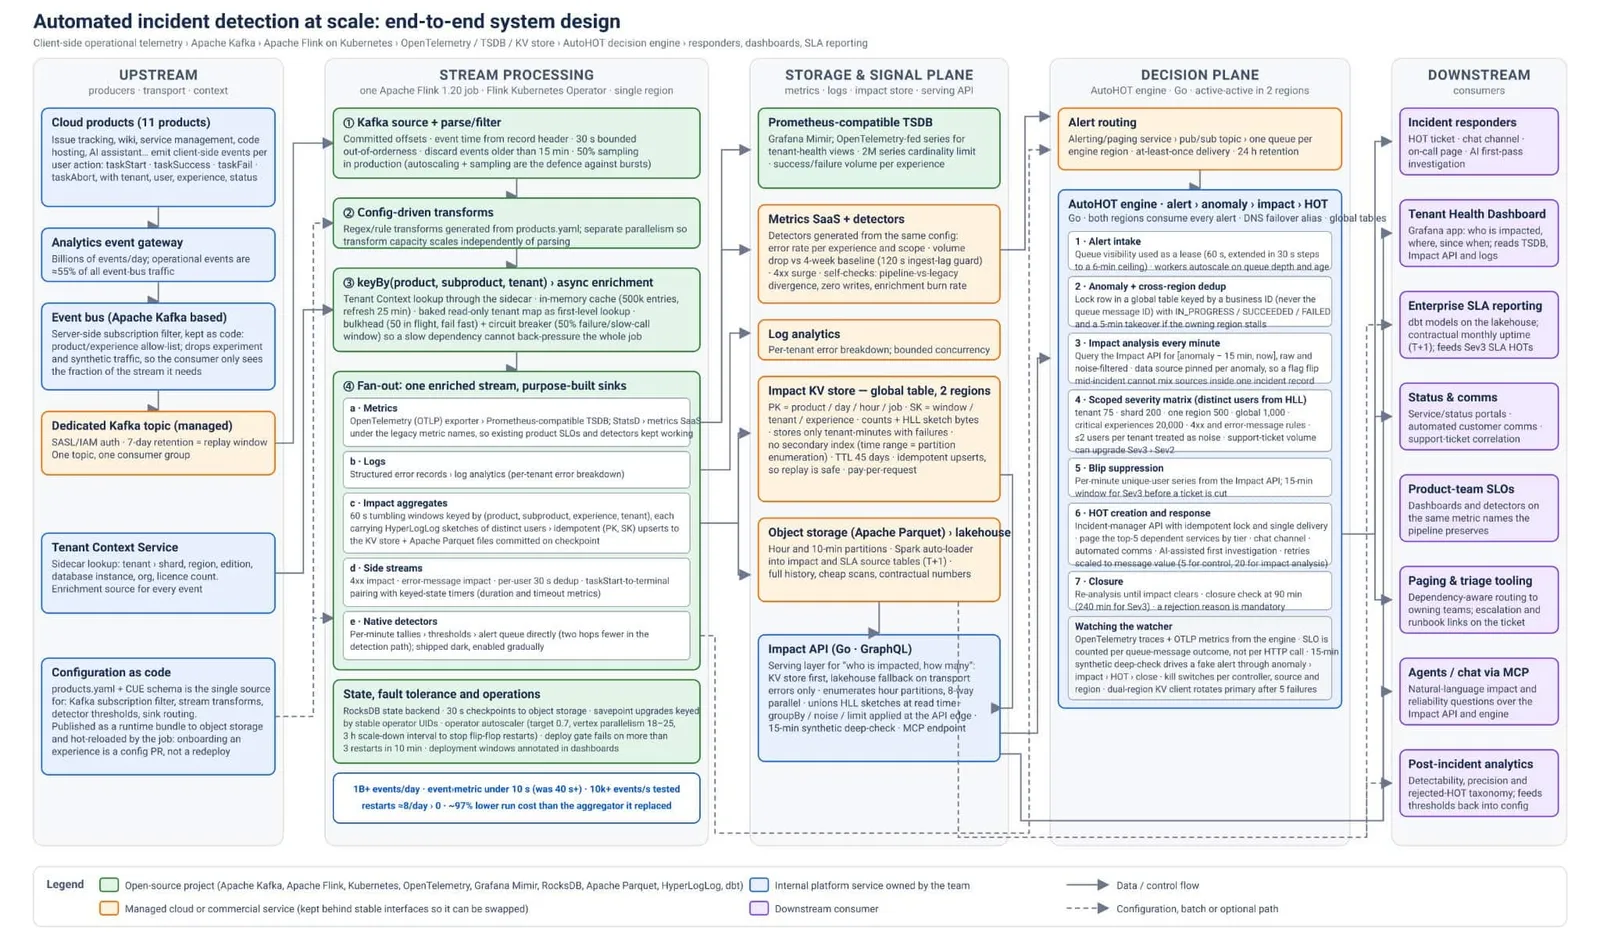
- Cost that scaled with onboarding. Adding products and experiences took the run cost from roughly $120K to $230K a year, and the cache tier hit 100% CPU during a routine change. We also had a correctness problem that only became visible once we had better data. Client-side telemetry only exists when a page loads. A hard-down database shard produces silence, not errors. Any design that only looks for failures will read silence as health. Design goals We wrote down five goals before choosing technology, and they are worth stating because they explain most of the trade-offs below. GoalConcrete target LatencyEvent to metric under 10 seconds; detector decision on the next minute boundary IsolationA dedicated consumer path; no shared queue in the critical path Correctness under replayIdempotent writes so that a restart or replay never double-counts impact CostRun cost that grows with event volume, not with the number of onboarded experiences OperabilityOne configuration source for filters, transforms, thresholds and sinks; onboarding an experience should be a pull request, not a deploy Architecture [Figure 1 ] End-to-end architecture: upstream producers and transport, the Apache Flink job, the storage and signal plane, the AutoHOT decision engine, and downstream consumers The full system, upstream to downstream. Green boxes are open-source projects, amber are managed or commercial services kept behind stable interfaces, blue are services our team owns, purple are consumers. Reading left to right: Upstream. Products emit operational events through an analytics gateway into the company event bus, which is built on Apache Kafka. Rather than consume the whole firehose, we register a server-side subscription filter, kept as code: an allow-list of products and experiences, with experiment and synthetic traffic dropped at the bus. The matching fraction lands on a dedicated Kafka topic with a seven-day retention that doubles as our replay window. Two side inputs feed the pipeline: a tenant-context service (tenant to shard, region, edition, licence count) and a configuration repository. Stream processing. One Apache Flink 1.20 job, deployed through the Flink Kubernetes Operator, does the work. Details in the next section. Storage and signal plane. Metrics go to a Prometheus-compatible time-series database via OpenTelemetry, and to a commercial metrics service where our detectors currently run. Per-minute impact aggregates go to a multi-region key-value store and to Apache Parquet files in object storage, from where a lakehouse builds the contractual SLA tables. A small Go GraphQL service, the Impact API, serves “who is impacted and how many” questions from those stores. Decision plane. The AutoHOT engine (Go, active-active in two regions) turns detector alerts into anomalies, quantifies impact every minute through the Impact API, applies a scoped severity matrix, suppresses blips, creates the incident ticket, pages the right teams and keeps re-evaluating until the impact clears. Downstream. Responders, the tenant health dashboard, enterprise SLA reporting, status and comms tooling, product-team SLO dashboards, and post-incident analytics that feed thresholds back into configuration. What we built
- Let the bus do the filtering The first decision was to stop being a “direct consumer of everything”. Operational events are about 55% of all traffic on the bus. Our subscription filter is a ~770-line YAML file generated from the same product configuration that drives everything else, so the pipeline only sees the products and experiences it is responsible for. This alone removed a whole class of scaling work and made the topic small enough that seven days of retention is cheap.
- One Flink job, deliberately We run a single job rather than one per product. The graph is: kafka-source -> filter-and-parse (drop events > 15 min old, 401s, no-user events) -> apply-transformations (config-driven regex/rule transforms) -> keyBy(product, subproduct, tenant) -> event-enricher (async, tenant-context sidecar, cache, bulkhead + circuit breaker) -> fan-out: metrics -> OpenTelemetry (OTLP) exporter -> Prometheus-compatible TSDB -> StatsD (legacy metric names preserved) logs -> log analytics user-dedup -> 30 s keyed TTL state -> distinct-user counters aggregate -> 60 s tumbling windows keyed (product, subproduct, experience, tenant) carrying HyperLogLog sketches -> key-value store (idempotent PutItem on (PK, SK)) -> Parquet FileSink (committed on checkpoint) side streams -> 4xx impact, error-message impact, taskStartterminal pairing (timers) detectors -> per-minute tallies -> thresholds -> alert queue (shipped dark) Some of the choices that matter:
- Async enrichment with a bulkhead and a circuit breaker. The tenant-context lookup is the one external call in the hot path. It runs through a sidecar with a 500k-entry in-memory cache, a baked read-only tenant map as the first-level lookup, a semaphore bulkhead that fails fast at 50 in-flight calls, and a circuit breaker that opens on a 50% failure or slow-call rate. Before this, a slow dependency back-pressured the whole job. After it, we have not had an enrichment-induced stall.
- HyperLogLog instead of user IDs. “Distinct impacted users” has to be mergeable across minutes, tenants, shards and regions. Summing per-row counts double-counts. Each 60-second window carries an HLL sketch; the Impact API unions sketches at read time for any grouping the caller asks for. The cost is format coupling between the Java producer and the Go consumer (we shipped one hotfix when the sketch precision parameter drifted) and about 1.5% error, which nobody has noticed.
- Idempotent sinks, at-least-once metrics. The key-value store key is (product, day, hour, job) plus (window, tenant, subproduct, experience), so replaying the topic rewrites identical rows. Parquet files roll on checkpoint, so they are exactly-once. Metrics are fire-and-forget: a restart produces a two to three minute dip followed by a replay surge, and we accept that because detectors read the pre-aggregated store, not the raw counters.
- Preserve the old metric names. The StatsD path emits under the legacy metric names. Product teams’ SLO dashboards and detectors did not have to change on cutover day, which is the only reason cutover day was boring.
- RocksDB, 30-second checkpoints, savepoint upgrades. State lives in RocksDB, checkpoints go to object storage every 30 seconds, and upgrades restore from savepoints keyed by stable operator UIDs. We learned the hard way that a topology change deployed with “undeploy and redeploy” discards state silently; we now treat operator UIDs as an API.
- Autoscaler tuning is a reliability feature. Early on every rescale was a full job restart and we saw around eight restarts a day. Setting the operator autoscaler to a 0.7 target utilisation, a 0.3 boundary, vertex parallelism between 18 and 25 and a three-hour scale-down interval took that to zero. Our production deploy pipeline now fails if the job restarts more than three times in ten minutes.
- Configuration as the control plane. A single products.yaml with a CUE schema generates the Kafka subscription filter, the transforms, the detector thresholds and the sink routing. Since mid-2026 the job hot-loads a runtime bundle of that config from object storage, so onboarding an experience no longer needs a redeploy. Operator design: knowing when to merge and when to split One of the more nuanced lessons from building this job was that operator granularity isn’t a one-time architectural decision — it’s something you revisit as the job matures under real load. We learned this in both directions. Merge when you’re doing redundant work. Early on, the pipeline had a filter followed by a map: the filter would parse the JSON to decide if a message was worth processing, and then the map would parse it again to deserialize it into a typed Payload. Combining these into a single flatMap — parse once, emit only if valid — eliminated the redundant deserialization entirely. The same principle led us to use Flink side outputs for fan-out to log analytics, StatsD, and OpenTelemetry rather than separate operators: one pass through the graph, three destinations. Split when operators have different scaling needs. The opposite lesson came later, under production load. We had our JSON parsing and transformation logic running in a single operator, but the enrichment step — doing async lookups to resolve tenant metadata — was pegging at 100% CPU and becoming a bottleneck for the entire pipeline. The fix was to explicitly separate “Phase 1: parse and filter (I/O bound)” from “Phase 2: apply transformations (CPU bound)” so each could be assigned its own parallelism independent of the other. What looks like one logical step on a whiteboard can become two distinct operators in Flink the moment they have different resource profiles under real traffic. The heuristic we landed on: merge operators when they touch the same data in the same pass, split them when they need to scale independently. Flink’s uid() annotations on every operator enforce this discipline — once you name and checkpoint an operator, you’re committed to its boundary, which forces you to think carefully before drawing it.
- The decision engine Detectors fire on the metrics. The alert travels through the paging service, a pub/sub topic and one queue per engine region. Both regions consume every alert; correctness comes from a lock row in a multi-region table keyed by a business de-duplication ID, never the queue message ID, with a five-minute takeover if the owning region stalls. The incident-manager API adds a second, authoritative lock, which is the last line of defence against rep
正文由 探How 从来源站点 RSS 同步,内容未经改写;遇到排版缺失或需要图片、视频时请以原文为准。