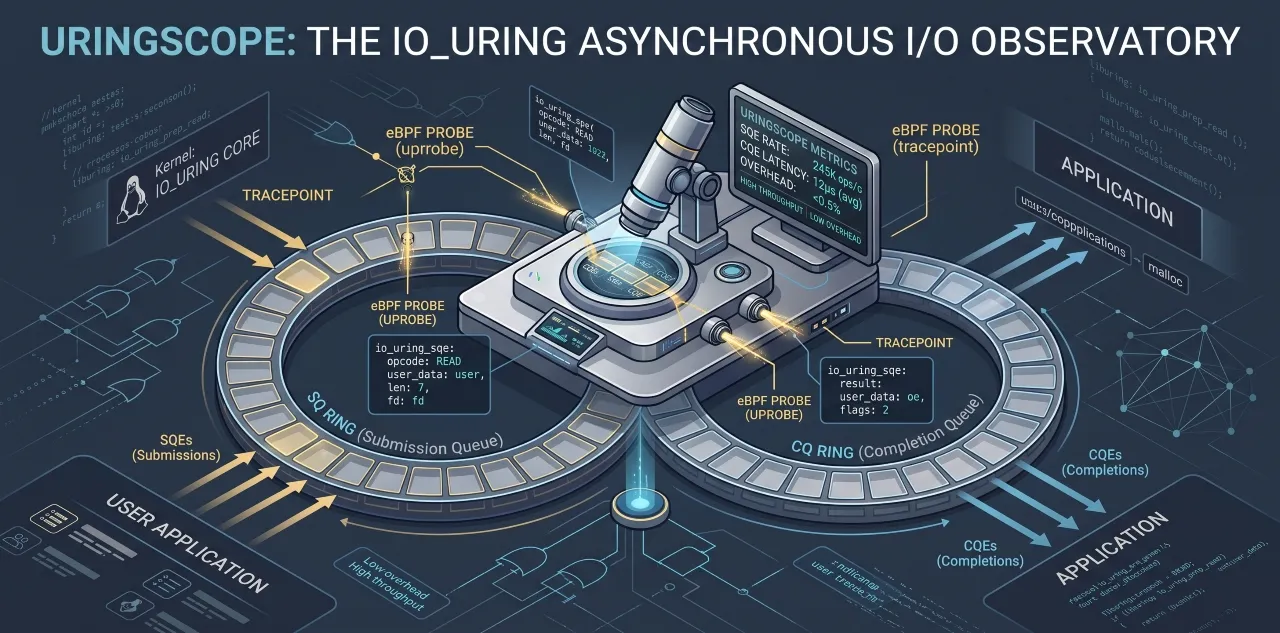
Uringscope: eBPF Tracer and Analyzer for io_uring
Kernel and userspace tracing for io_uring. A single-binary tracer and
以下正文同步自 Hacker News 最新,版权归原站所有,已转换为易读排版。
Kernel and userspace tracing for io_uring. A single-binary tracer and analyzer. It attaches to any process that uses io_uring, whatever the language or runtime, and reconstructs what each request did: per-opcode latency, hidden async-worker punts, batching efficiency, and stalls. The report ends with findings that name the problem and suggest a fix.
one static binary, no toolchain, no runtime deps beyond a BTF kernel
curl -LO https://github.com/rch0wdhury/uringscope/releases/latest/download/uringscope-$(uname -m) chmod +x uringscope-$(uname -m) sudo mv uringscope-$(uname -m) /usr/local/bin/uringscope
the three commands you'll reach for most:
sudo uringscope ./myapp # run a program under the scope sudo uringscope -p 31337 -d 30 # watch a running pid for 30 seconds sudo uringscope -a -d 10 # everything on the box for 10 seconds
(Prefer a package or building from source? See Install / build.)
Each run prints a per-ring report that ends in a findings section. It looks like this:
$ sudo uringscope ./myapp ... myapp runs ...
uringscope report (12.4s, 8 cpus)
ring #0 fd=5 sq=256 cq=512 flags: (none) myapp pid 31337
submission io_uring_enter() calls 1,204,332 SQEs submitted 1,209,544 avg batch 1.0/enter <-- ! completions 1,209,540
per-op latency (submit -> complete) READ 1,102,238 reqs p50 14us p99 1.2ms punted 63.1% <-- ! WRITE 91,002 reqs p50 22us p99 410us punted 2.0% ...
findings [BATCH] You average 1.0 SQEs per io_uring_enter(). You are paying a syscall per request -- the thing io_uring exists to avoid. Queue more SQEs before calling submit. [PUNT] 63% of READ requests fell off the fast path into io-wq worker threads (likely buffered reads missing the page cache). This is where your p99 lives. Consider O_DIRECT + registered buffers, or provoke readahead.
io_uring carries its request flow through shared-memory rings rather than a syscall per request, so syscall-level tracing sees only ring setup, not the requests inside. uringscope reads the kernel's io_uring tracepoints, adds optional liburing uprobes for the userspace boundary, and stitches the events back into per-request flows. The kernel ships ~18 static tracepoints for this, but their prototypes are not ABI and have changed every few releases. uringscope probes kernel BTF at startup and picks the program variants that match the running kernel.
The releases page carries a static binary per architecture (x86_64, aarch64) plus .deb and .rpm packages. The packages wrap the same static binary, so they install on any distro with a BTF kernel and pull in no libraries of their own:
sudo dpkg -i uringscope_<ver>_amd64.deb # Debian/Ubuntu sudo rpm -i uringscope-<ver>-1.x86_64.rpm # Fedora/RHEL
To build from source instead:
Debian/Ubuntu
sudo apt install clang libbpf-dev linux-tools-common linux-tools-$(uname -r)
Fedora
sudo dnf install clang libbpf-devel bpftool
make # ./uringscope make STATIC=1 # fully static binary you can scp anywhere sudo make install # -> /usr/local/bin (PREFIX= to relocate)
Runtime requirements: a kernel with CONFIG_DEBUG_INFO_BTF=y (stock on mainstream distros since around 5.15) and CAP_BPF + CAP_PERFMON, or root. The tool links only libbpf, libelf, and zlib. liburing is not a dependency of uringscope itself. It is needed only to build the test injector (test/faults/inject.c) and by the fio benchmark workloads (apt install liburing-dev fio for those).
sudo uringscope ./myapp --my-args # run a command under the scope sudo uringscope -p 31337 -d 30 # watch a running pid for 30s sudo uringscope -a -d 10 # everything on the box, 10s sudo uringscope -c -p 31337 # compact: per-op table + findings,
like strace -c
sudo uringscope -e op=READ,WRITE -p 31337 # display only these opcodes sudo uringscope -e punt -p 31337 # ...or only punted / -e error sudo uringscope -f -p 31337 # follow children/threads too sudo uringscope -i 2 -p 31337 # live per-op deltas every 2s sudo uringscope --metrics :9090 -p 31337 # OpenMetrics at :9090/metrics sudo uringscope --json report.json -- ./myapp # machine-readable report sudo uringscope --json --fail-on=warn -p 31337 -d 10 # CI/agent gate: exit 3
on a finding >= warn
sudo uringscope --baseline b.json -- ./myapp # save for later --diff sudo uringscope --diff b.json -- ./myapp # delta table vs the baseline sudo uringscope --trace t.json -- ./myapp # + Perfetto timeline sudo uringscope --check -- ./myapp # hazard mode: buffer races,
reg-buffer lifetime, unmap-UAF
sudo uringscope --no-findings -p 31337 # numbers only, no findings uringscope --version # version + kernel support tiers uringscope --list-ops # the opcode table
(-c was the short form of --check before 0.2. It now means the strace-style compact summary, and --check is long-form only.)
--check is a higher-overhead debugging mode. Run your io_uring test suite under it the way you would under ASan. It catches two in-flight requests targeting overlapping memory, which corrupts data silently and returns no error.
Containers: Docker's default seccomp profile blocks the io_uring syscalls entirely, so the interesting targets are bare-metal and VM workloads (databases, storage engines, io_uring-native runtimes).
PID namespaces (WSL2 distros, containers): the kernel reports root-namespace tgids while you filter on namespaced pids. uringscope detects that it is in a child pid namespace and translates inside the BPF programs, so uringscope ./myapp works unchanged under WSL2.
Section Source What to look for
avg batch / enter syscalls:sys_enter_io_uring_enter under 2 means you pay syscall overhead per request
punted % io_uring:io_uring_queue_async_work high % on READ/WRITE means the fast path was missed, usually where the p99 comes from
sqpoll off-cpu sched:sched_switch on iou-sqp-* the poller you paid a core for is asleep. Raise sq_thread_idle or drop SQPOLL
workers seen sched:sched_switch on iou-wrk-* unbounded fan-out means blocking ops (buffered I/O, fsync) are flooding io-wq
CQ overflow io_uring:io_uring_cqe_overflow CQ ring too small or reaping too slow. Completions took the slow path
poll-retry io_uring:io_uring_poll_arm sockets/pipes not ready at submit. Normal for network, news for disk
untracked completions (tool fidelity) requests submitted before attach, or map pressure. Latency stats cover tracked requests only
Guides
Profiling PostgreSQL 18's io_uring. PostgreSQL 18 can submit reads through io_uring with io_method=io_uring. The guide shows which access paths actually use it (fewer than you might expect), which knobs move the findings, and how to read an empty report. Everything in it was measured against a live 18.6 cluster.
Kernel support
Kernel Tier Notes
6.1+ (incl. 6.6, 6.8, 6.12 LTS) full modern tracepoint prototypes
5.15 LTS counters + batching legacy submit_sqe/complete prototypes, no punt attribution
< 5.15 unsupported
uringscope probes the running kernel's BTF at startup and enables only the program variants whose tracepoints exist, by name and prototype. A missing tracepoint disables one feature instead of failing the load. See test/kernels.txt for the CI matrix. test/vmtest/run.sh <kernel> boots a kernel under virtme-ng/KVM and runs the full suite on it, checking that the BTF probe selected the right variant (for example 6.17's cqe-collapsed io_uring_complete) and that every injected fault is still detected. CI runs this matrix nightly.
CO-RE eBPF, tp_btf attachments to the kernel's io_uring tracepoints.
Request state is read from the io_kiocb pointer through minimal, relocatable shadow structs (bpf/io_uring_shims.bpf.h) rather than positional tracepoint arguments, because the struct fields have been far more stable than the tracepoint prototypes.
Known layout changes (like io_kiocb.user_data moving into io_kiocb.cqe in 5.19) are handled with CO-RE flavors and bpf_core_field_exists().
Renamed or re-prototyped tracepoints are handled with multiple compiled program variants. src/probe.c inspects kernel BTF and flips autoload per variant before load.
The default mode aggregates everything in kernel maps (per-opcode log2 latency histograms, counters) and userspace reads the maps once at exit. --trace streams per-request records over a ring buffer instead.
Testing / validating effectiveness
test/faults/ deliberately injects faults and scores the findings against ground truth:
make # build uringscope cd test/faults && sudo ./run.sh
inject.c induces one anomaly per scenario (punt storm, no batching, CQ overflow, error floods, dropped/leaked requests, SQPOLL stalls, worker storms, buffer use-after-unmap, registered-buffer races and lifetime violations, and reaping lag) and prints machine-readable GROUND-TRUTH lines. run.sh runs each under the scope and checks the finding was reported. The same harness produces the detection-effectiveness table.
bench/ contains the fio workloads, baseline commands, and collection script used for the overhead-vs-fidelity evaluation. See bench/README.md.
The JSON report is a versioned machine API ("schema": 2, documented in docs/json.md). Every finding carries a stable tag (PUNT, BATCH, OVERFLOW, HAZARD, ...), structured numeric evidence, and a suggested fix, so nothing has to parse the human tables. With --fail-on, the verdict is in the exit code:
sudo uringscope --json=report.json --fail-on=warn -p "$PID" -d 10 || alert
Exit codes: 0 clean · 1 uringscope error · a spawned command's nonzero status propagates · 3 a finding at or above the threshold.
For AI coding agents, skills/uringscope/ ships an agent skill (SKILL.md, following the Agent Skills open standard used by Claude Code and other tools). It tells an agent when to reach for uringscope and maps each finding tag to concrete code-level fixes in liburing, tokio-uring, glommio, and netty. To install for Claude Code:
cp -r skills/uringscope ~/.claude/skills/ # all your projects cp -r skills/uringscope your-project/.claude/skills/ # one project
Status
Early. The aggregate mode, findings rules, hazard (--check) detectors, live/metrics/JSON output, liburing-uprobe boundary timing, and Perfetto export work on modern kernels. The 5.15 legacy tier remains best-effort (counters and batching only). If the startup tier summary shows a degraded or missing feature on your kernel, please open an issue with uname -r and the output of bpftool btf dump file /sys/kernel/btf/vmlinux format c | grep io_uring_. Tracepoint churn reports are the most useful thing you can send this project.
Bug reports, tracepoint-churn reports, and finding disputes are all welcome on the issue tracker. See CONTRIBUTING.md for how to run the test suites and what a good report looks like.
If you use uringscope in your research, please cite it (see CITATION.cff). The archived release is on Zenodo: 10.5281/zenodo.20672340.
BPF programs: GPL-2.0-only OR BSD-3-Clause. Userspace: MIT. See LICENSE.
正文由 探How 从来源站点 RSS 同步,内容未经改写;遇到排版缺失或需要图片、视频时请以原文为准。